

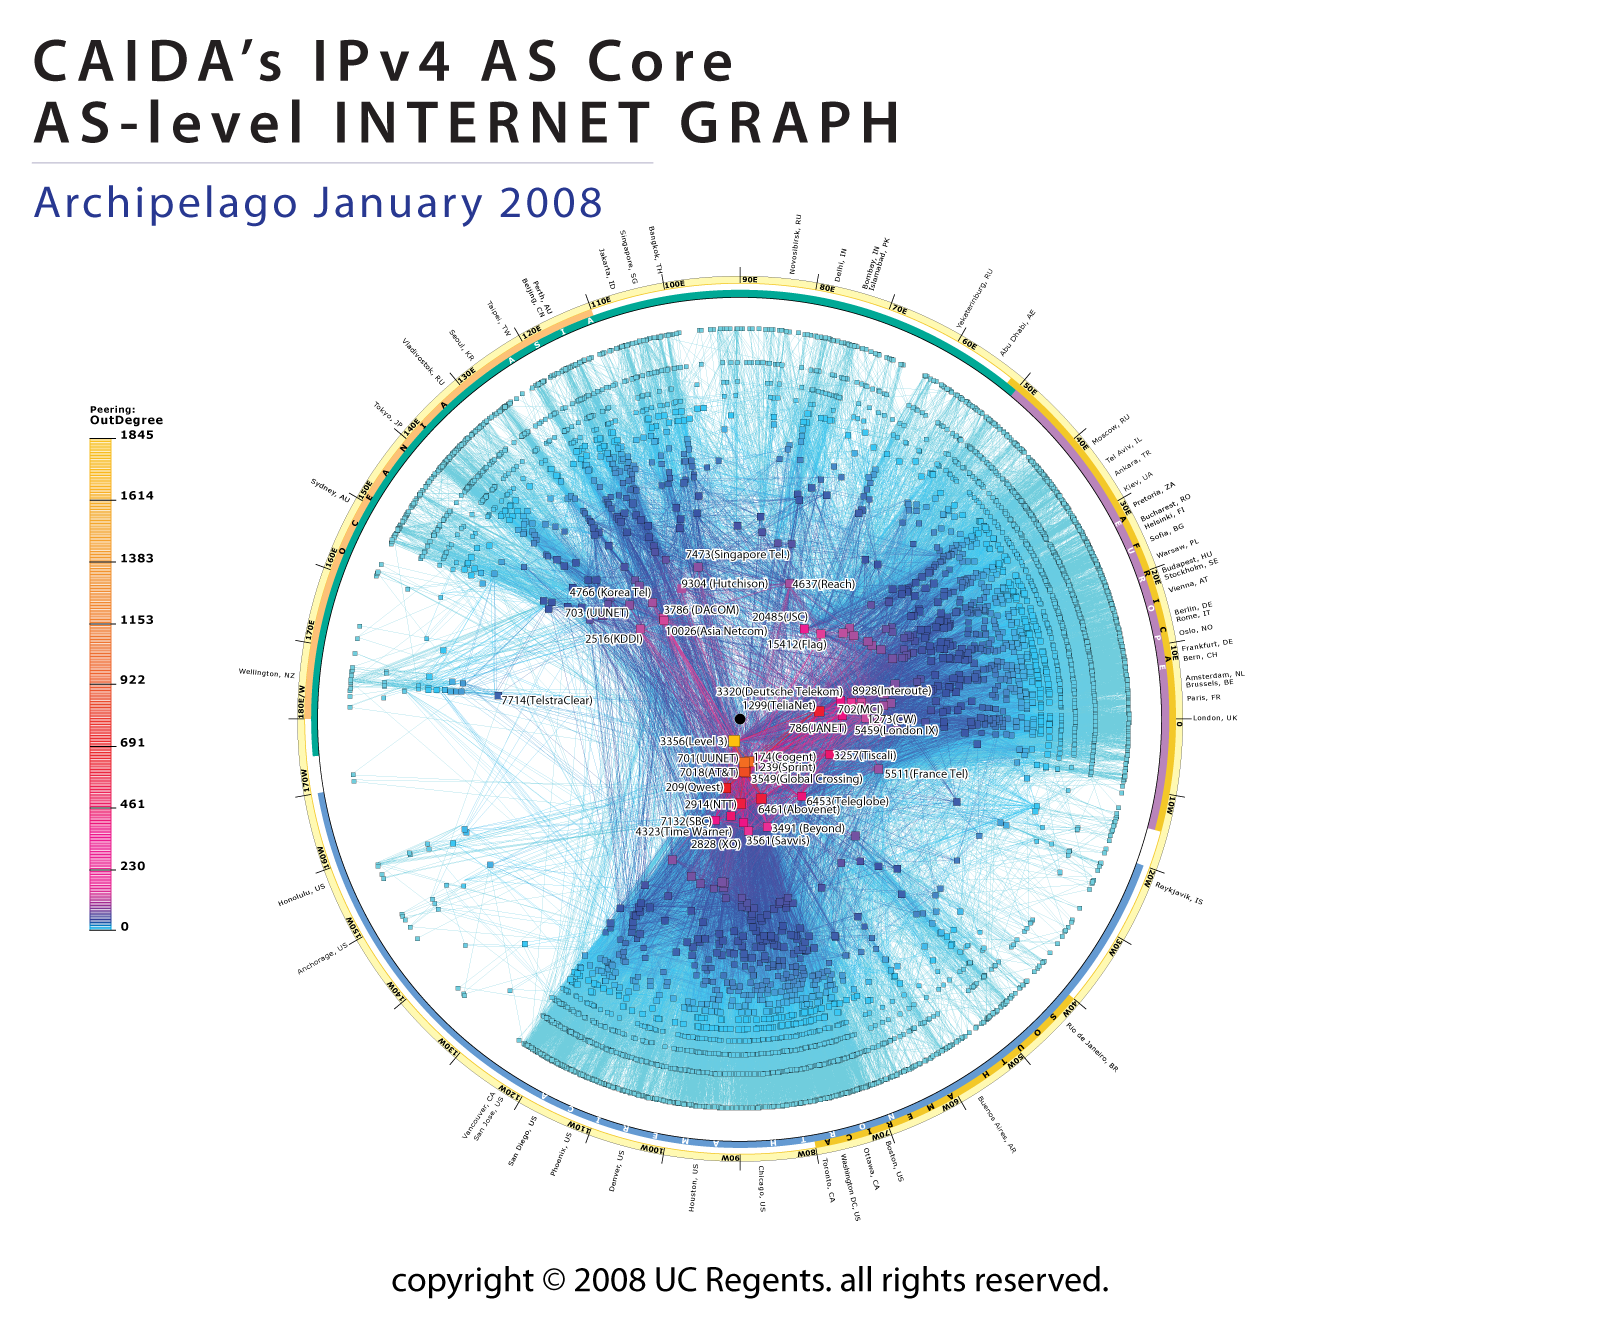
 Figure 1. IPv4 AS Core January 2008.
Data Source
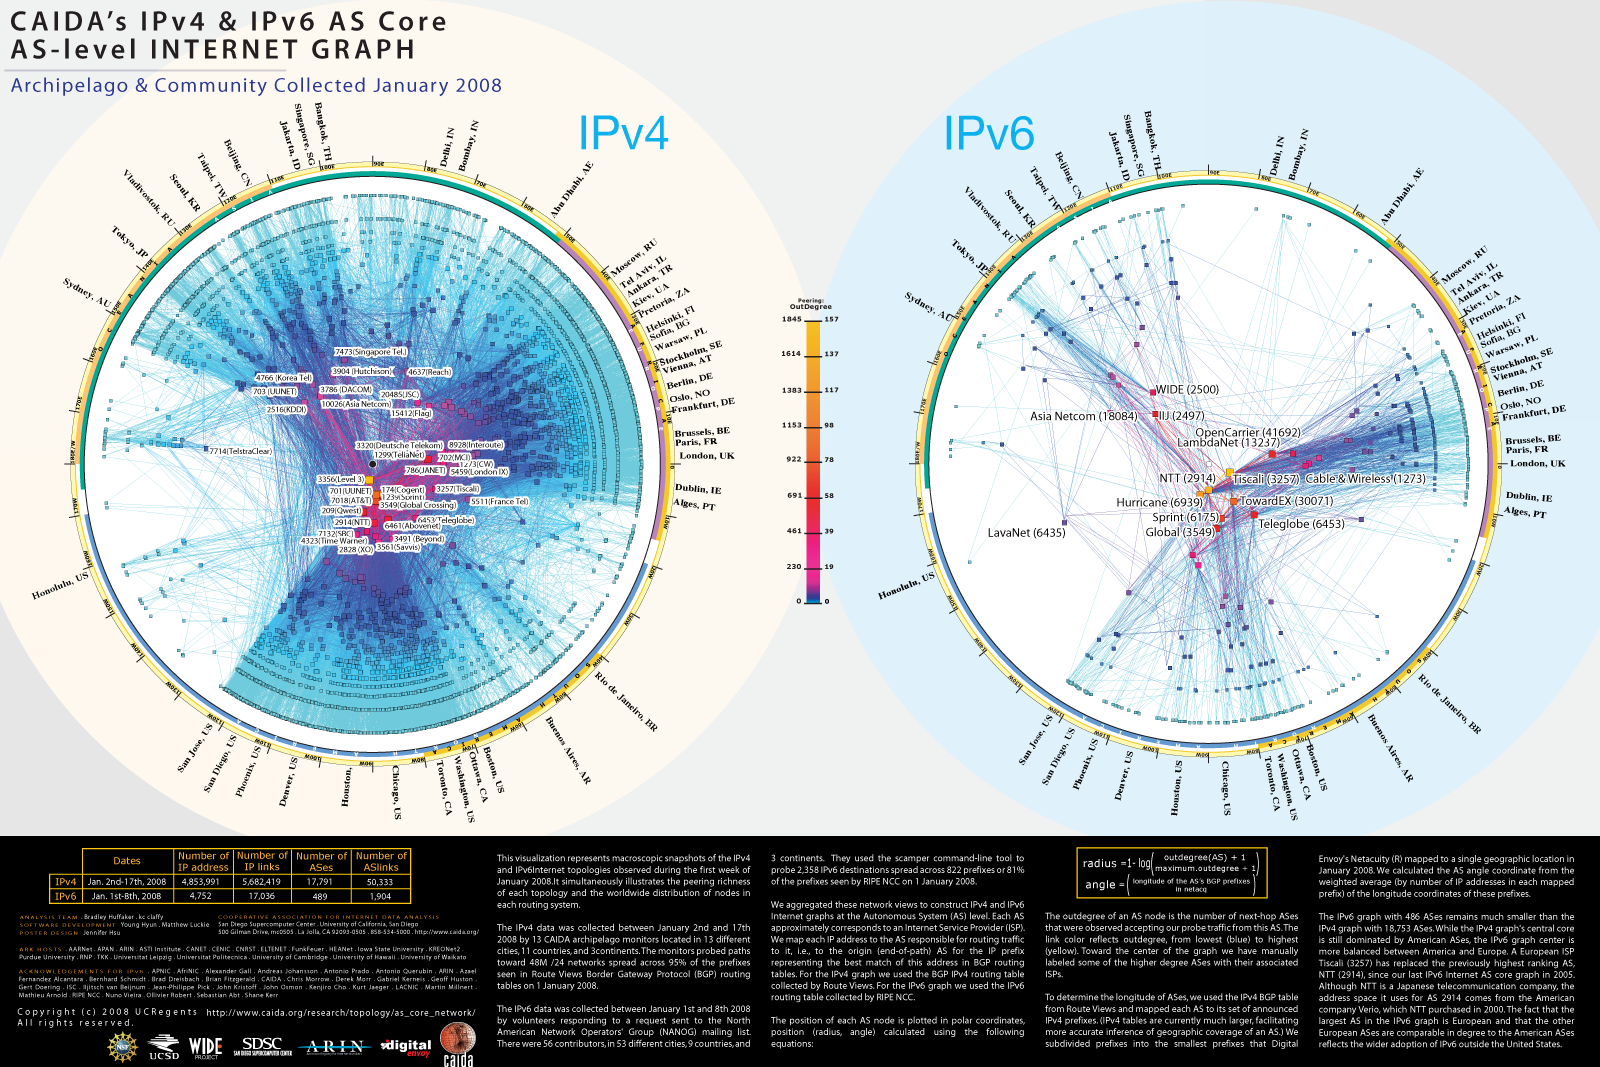
This visualization represents a macroscopic snapshot of the Internet for two weeks: 1-17 January 2008. The graph reflects 4,853,991 observed IPv4 addresses and 5,682,419 IP links (immediately adjacent addresses in a traceroute-like path) of topology data gathered from 13 monitors probing 48,535,339 /24s spread across 235,286 (49.3% were reached) globally routable network prefixes (94.9% of the total prefixes seen in RouteViews on 1 January 2008).
We then aggregate this view of the network into a topology of Autonomous Systems (ASes), each of which approximately maps to an Internet Service Provider (ISP). We map each IP address to the AS responsible for routing traffic to it, i.e., the origin (end-of-path) AS for the best match IP prefix of this address in Border Gateway Protocol (BGP) routing tables. We use BGP routing tables from the University of Oregon's RouteViews project. The abstracted graph consists of 18,753 Autonomous System (AS) nodes and 51,577 peering sessions. For 901 ASes we could not determine a geographic location. The resulting graph contains 17,791 ASes and 50,333 peering sessions.
We mapped these ASes to geographic locations by taking the IPv4 BGP table from Routeviews and mapping each AS to its set of announced prefixes. We subdivided prefixes into the smallest prefixes that Digital Envoy's Netacuity ® mapped to a single geographic location in January 2008. We plot the AS angle coordinate at the weighted average (by number of IP addresses in each mapped prefix) of the longitude coordinates of these prefixes.
Layout
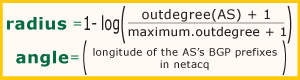
Figure 2. coordinates of AS in AS core.
The outdegree of an AS node is the number of next-hop ASes that were observed accepting traffic from this AS. The link color reflects outdegree, from lowest (blue) to highest (yellow). Some ISPs toward the center have been manually labeled.
2007 study. In contrast, we see a significant change in the ASes in Asia: they have smaller outdegree, and the highest degree ASes in Asia are different from the "big guys" from last year. UUNet's drop from first place to second place seen in our 2007 graph continues here, with Cogent essentially tied with UUnet. While ISPs in Europe and Asia have many peering relationships with ISPs in the U.S., we observed fewer links directly between ISPs in Asia and Europe (which may be a function of changes in our monitor locations since 2007). Both technical (cabling and router placement and management) as well as policy (e.g. business cost models and geopolitical considerations) factors contribute to peering arrangements represented in this graph.
Caveats
Our AS core visualization does have some limitations:
- Some organizations administer multiple ASes, although most of the time there is a one-to-one mapping between an AS and a network organization.
- The graph does not reflect current conditions, only a snapshot taken in January 2008.
- The graph represents forward IP topology information, with IP addresses mapped to origin ASes using a BGP routing table. The graph does not reflect all information about peering sessions or constitute a complete route map. Our BGP table view is unlikely to capture peering links which do not get announced beyond a single neighbor AS and therefore incomplete.
- The graph reflects observations of the IP layer only, and does not capture information regarding lower layers, e.g., ATM, physical fiber, information.
- The graph does not address any performance or workload measurements, precluding comparison of ISPs in these dimensions.
- Nodes with many links may be located on the outer rim if their AS has an observed outdegree of zero.
Conclusion
One of CAIDA's topology mapping project goals is to develop techniques to illustrate relationships and depict critical components of the Internet infrastructure. For more information about the topology mapping project, see: https://www.caida.org/projects/macroscopic/
For more information on methodology for ranking AS interconnectivity, see CAIDA's Introduction to Relationship-based AS Ranking.
Demonstration
If you would like to try out a demo of the CAIDA tools used to construct this graph, please see https://www.caida.org/projects/internetatlas/gallery/ascore/demo.
Poster
(PNG image, 998kb) (PDF, 3.9 MB)
Acknowledgments
CAIDA Topology Mapping Analysis Team: Brad Huffaker, kc claffy
ark developer: Young Hyun
scamper developer: Matthew Luckie
support: Dan Andersen