

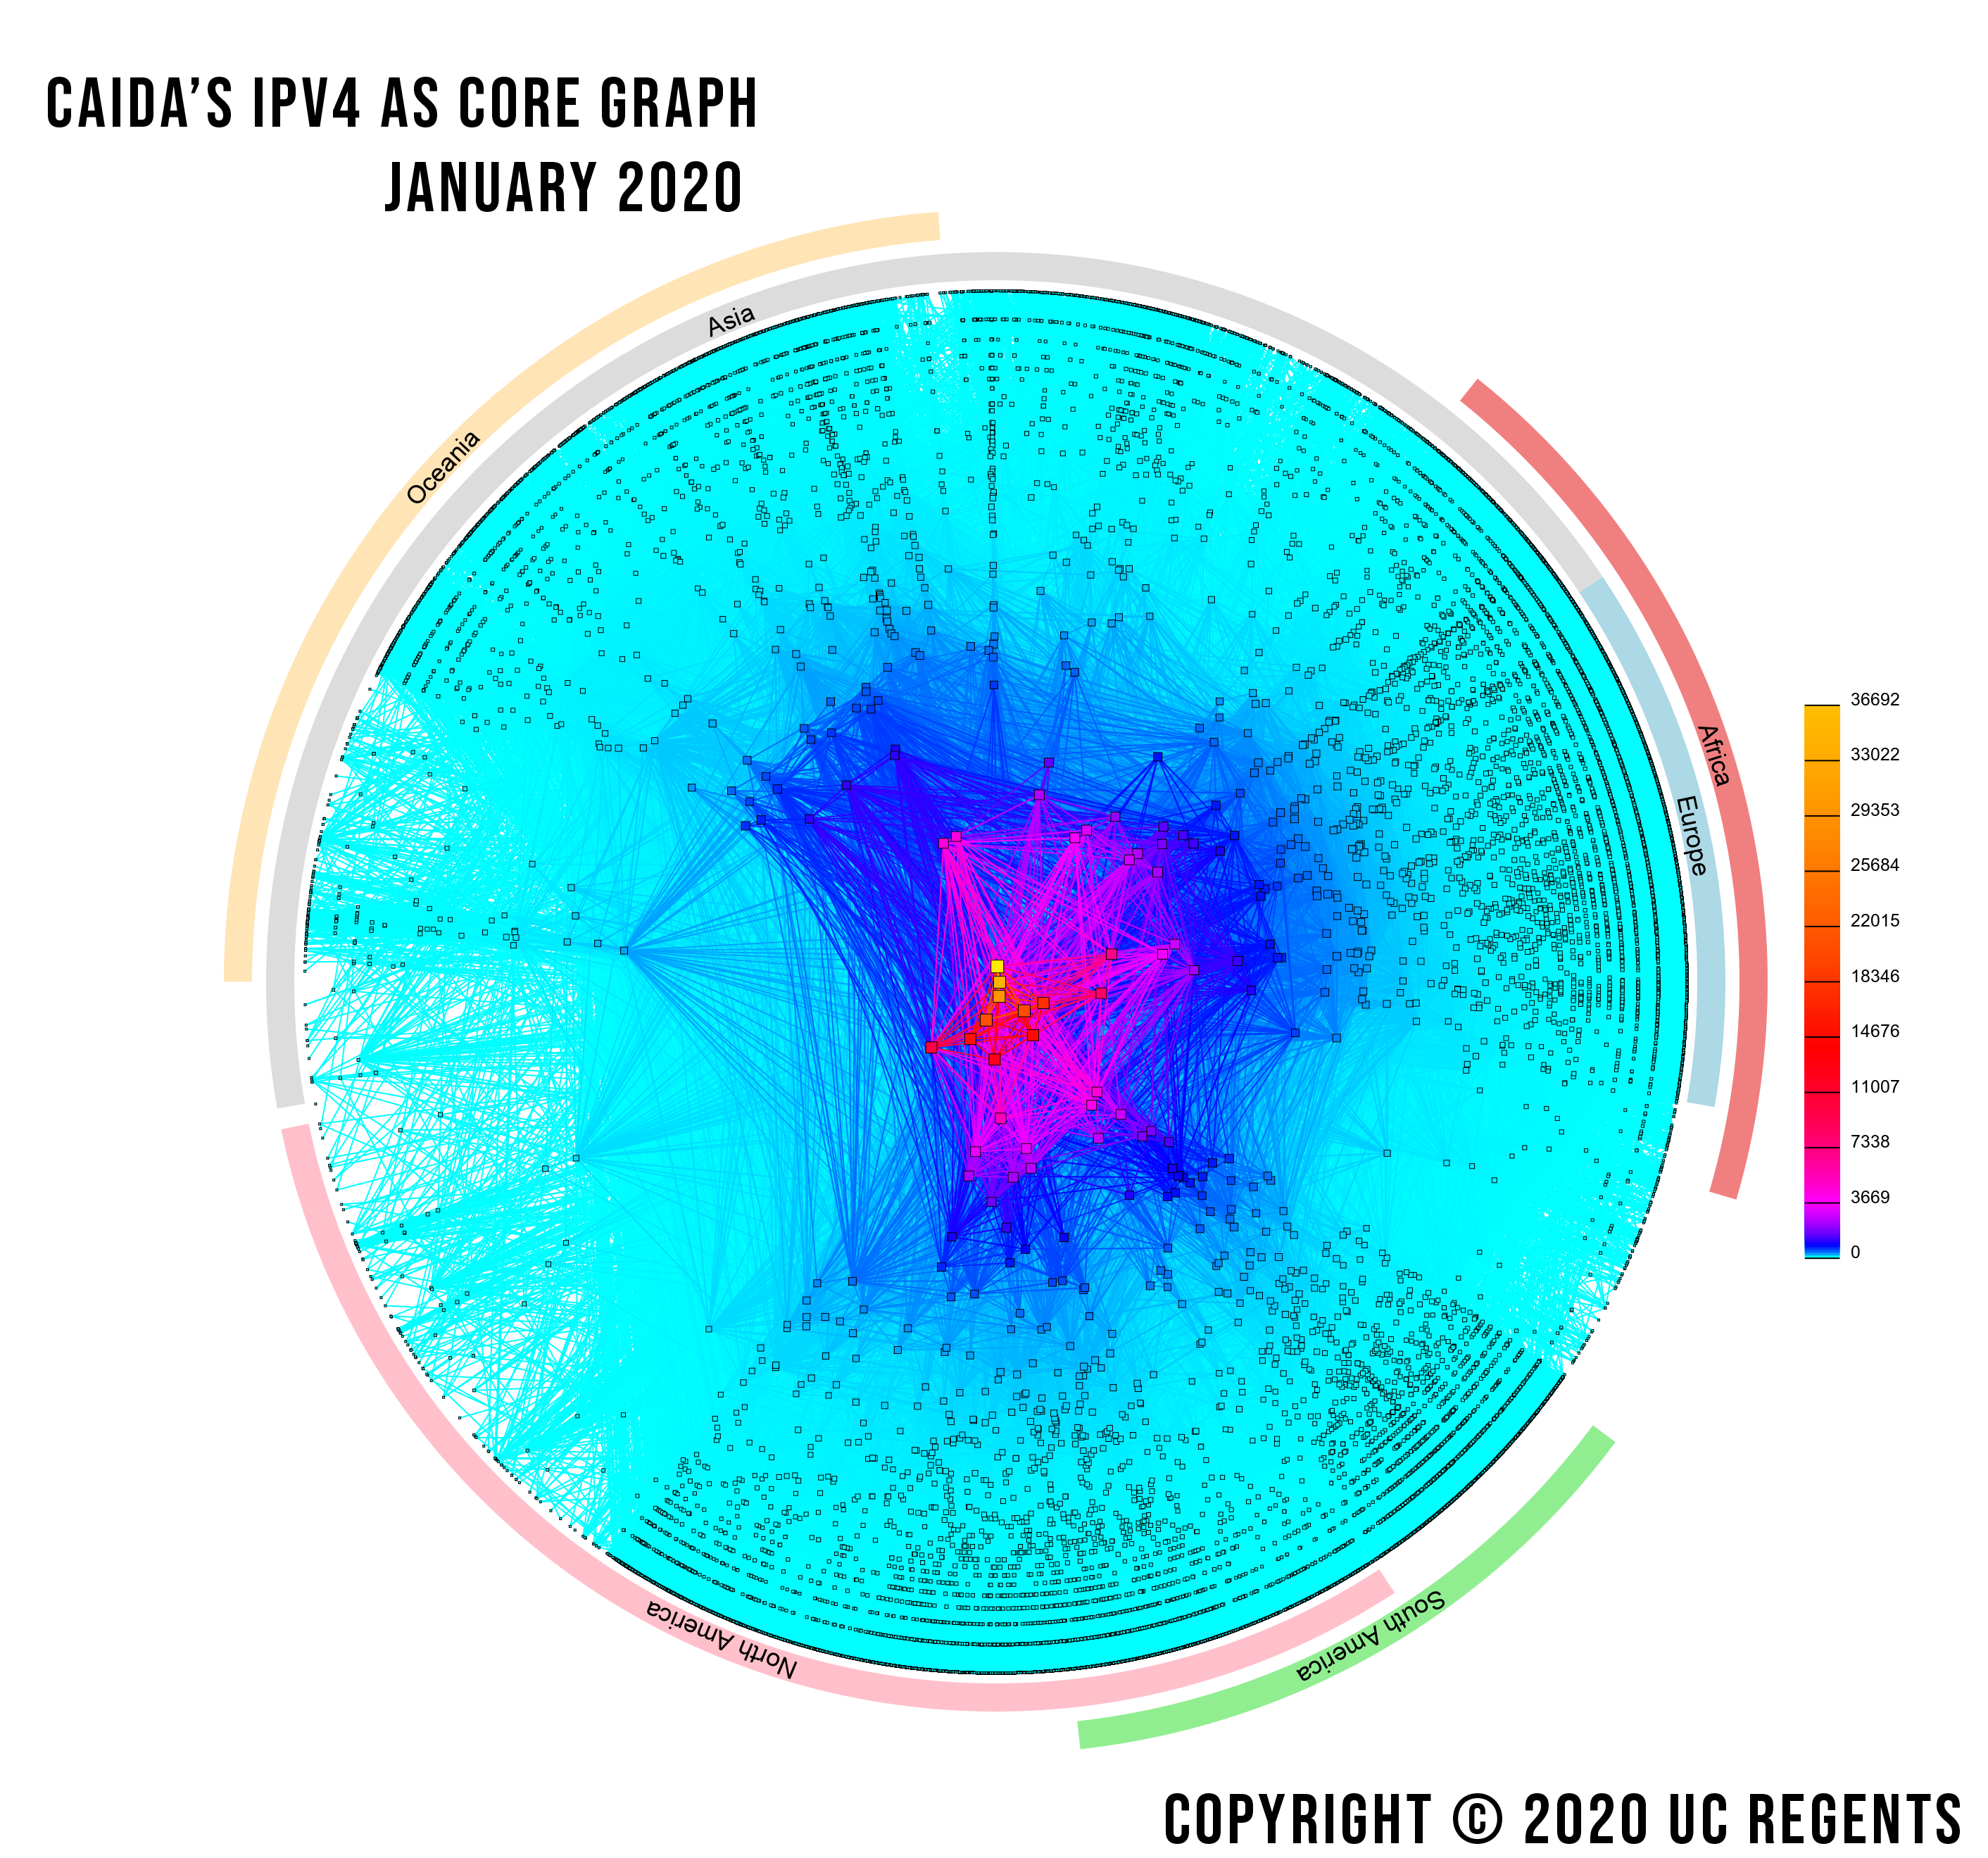
CAIDA's IPv4 and IPv6 AS Core: Visualizing IPv4 and IPv6 Internet Topology at a Macroscopic Scale in 2020
Introduction
The CAIDA AS Core visualization depicts the Internet’s Autonomous Systems’ (ASes) geographic locations, number of customers, and interconnections. Each AS approximately corresponds to an Internet Service Provider (ISP). The geographic location of the individual AS is inferred from the weighted centroid of its address space according to NetAcuity, a commercial geolocation service. The number of direct or indirect customers of an ASA is inferred using its customer cone (described below).
Changes in the IPv4 graph from 2017 to 2020
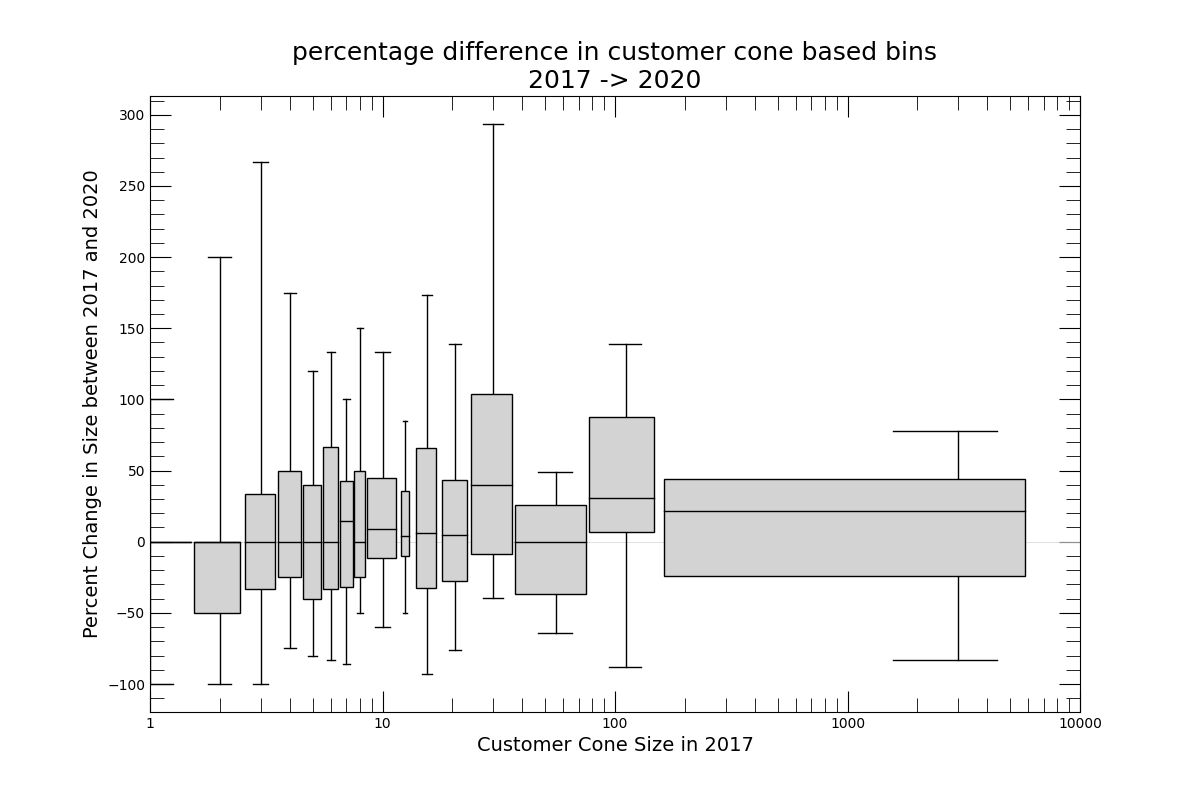
Between 2017, last time CAIDA produced an AS Core Poster, and 2020, the AS graph saw the largest ASes gain in customers, while the smallest ASes mostly stayed unchanged. For example, ASes with customer cone sizes of 11 or less represent roughly 97% of all ASes observed in either 2017 or 2020 remained relatively unchanged. For the remaining 3% of ASes, slightly more ASes saw an increase in the number of customers. The rightmost bin displays the largest 25 ASes representing cone sizes between 2,309 and 30,261. ASes within this bin at or above the median (50th percentile) to the 95th percentile increased between 21.45% to 100.46%. ASes within this bin from the 5th percentile to the median decreased their cone sizes between 57.23% to 4.25%.
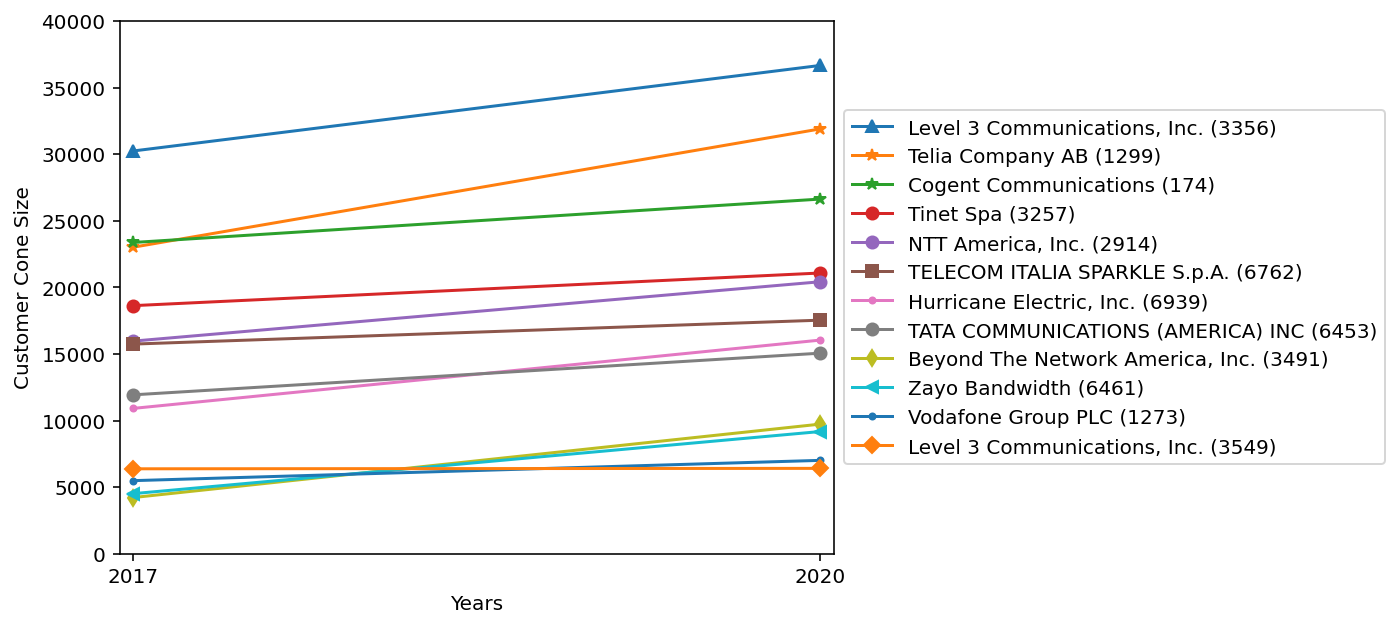
Figure 7A shows the change in size of the top 10 ASes with the largest IPv4 customer cones in either 2017 or 2020. All of these ASes increased their customer cone size between 2017 and 2020. The mean of observed change was a 38.53% increase, with a median increase of 27.08%. The largest growth was observed for Beyond The Network America, Inc. (3491) with a 130.87% increase to their customer cone size. Level 3 Communication remained the largest ASes with a cone size of 36,688 ASes in 2020.
Changes in the IPv6 graph from 2017 to 2020
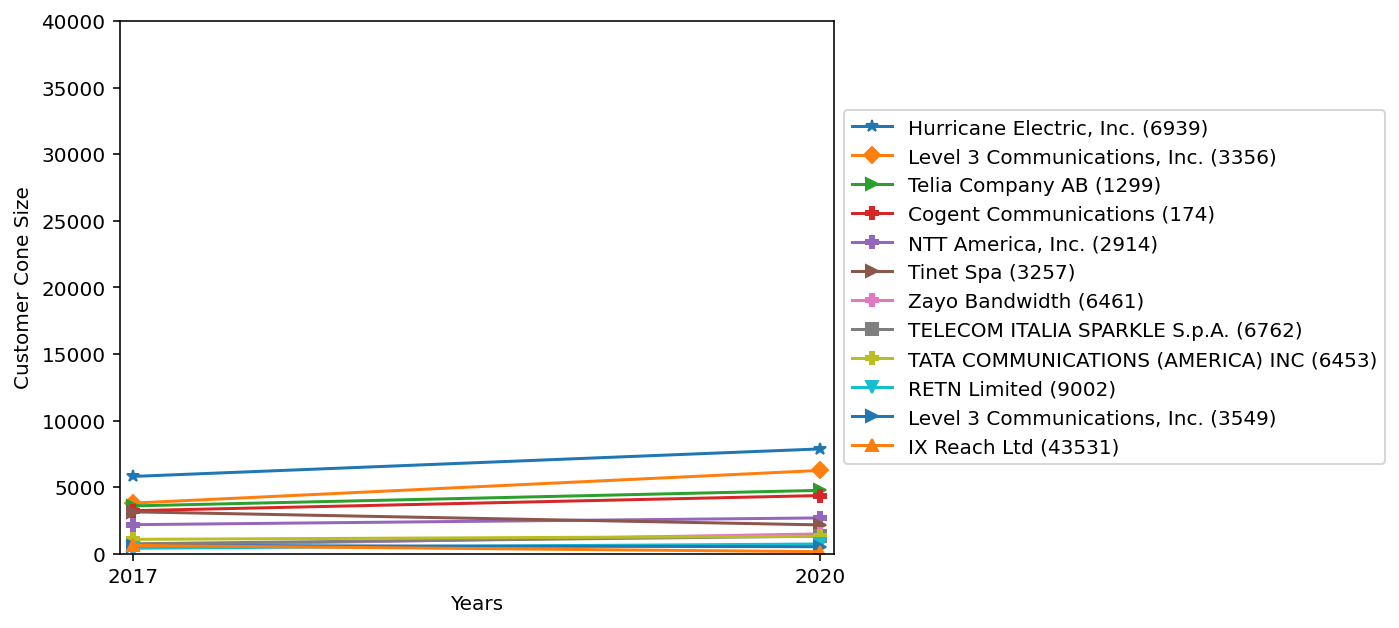
ASes saw a similar pattern in the IPv6 topology as in the IPv4 topology. ASes with customer cone sizes of 6 or less represent roughly 97% of all the ASes, which saw little to no growth between 2017 and 2020. The rightmost displays the top 29 IPv6 ASes representing customer cone sizes between 157 to 5,801. In this bin, ASes at above the median to the 95th percentile observed an increase between 21.76% to 116.92%. ASes from the 5th percentile to the median decreased between 92.46% to 24.40% from 2017 to 2020.
Of the 12 ASes, nine increased in size, the other three decreased. In total, the mean change in cone sizes of all 12 ASes is an increase of 32.87%, and a median growth of 33.92%. The nine ASes who increased observed a mean growth of 57.44%, and a median growth of 35.63%. The largest growth was observed from Zayo Bandwith (6461), which increase by 148.91%. Of the three ASes who observed decreases to their cone sizes, their mean decrease was 40.86% and a median decrease of 31.28%. The largest IPv6 customer cone as of January 2020 was from Hurricane Electric, Inc (6939), with a cone size of 7,868 Ases.
Internet Layers
The Internet’s network topology is often divided into four layers: AS, PoP, Router, and IP. The IP addresses an attachment point (interface) of a device on the Internet. The router layer refers to the set of routers that transfer and route trac. To support geophysically-aware topology analysis, we aggregate routers into Points of Presence (PoPs). To support interdomain (between networks) topology analysis, we aggregate routers by ownership into Autonomous Systems (ASes).
Customer Cone
The AS's customer cone is the set of ASes that directly or indirectly pay the AS to connect to the Internet.
The AS’s customer cone is the set of ASes that directly or indirectly pay the AS to
connect to the Internet. On the left, A has the largest cone with 6 ASes; H has two. An AS’s customer cone contains the set of ASes we observe the AS announce to its peers or providers. This definition is more constrained than, but similar to, the set of ASes reachable through its customers.
Data Source
CAIDA’s AS Core visualization represents a macroscopic snapshot of active (traceroute) and passive (BGP) topology samples captured over the first few days of January 2020. Each dot represents an Autonomous System (AS) which approximately corresponds to an Internet Service Provider (ISP). The geographic location of the individual AS is inferred from the weighted centroid of its address space according to NetAcuity, a commercial geolocation service. The size of each AS is equal to the logarithm of its customer cone, the number of inferred direct and indirect customers.
For the IPv4 visualization we used CAIDA’s Jan 2020 IPv4 Internet Topology Data Kit (ITDK) and AS Relationship data. We obtained the raw IPv4 topology data for the ITDK by performing traceroutes to randomly-chosen destinations in each routed BGP prefix using 159 Ark monitors located in 50 countries.
The AS Relationship dataset used full RIBs collected by 35 BGP collectors (17 from RouteViews and 18 from RIPE RIS) across the first five days of Jan 2020. The resulting AS topology contained 55,237 ASes, and 162,709 AS links found in union to both the January 2020 ITDK and AS Relationship datasets.
For IPv6, we used January 2020 data from CAIDA’s and IPv6 AS Relationship, since the ITDK did not include IPv6 data. We obtained the IPv6 topology data by using longest matching prefix to map the IPv6 addresses to ASes. The AS Relationship dataset used the same set of full RIBs from 35 BGP collectors across the first five days of January 2020. The resulting AS topology contained 12,246 ASes, and 54,351 AS links.
We map these AS level graphs into two, IPv4 and IPv6, AS Core graphs. The position of each AS node is plotted in polar coordinates (radius, angle) calculated as indicated above.
Conclusion
This AS core visualization addresses one of CAIDA’s topology mapping project goals, which is to develop techniques to illustrate structural relationships and depict the evolution of critical components of the Internet infrastructure. The IPv4 data shows the relative growth of this Internet topology from 2017 to 2020. The net change in the number of IPv4 ASes between 2017 and 2020 was 13,680 (+32.91%), and a 37,618 (+30.07%) increase of AS Links. This also includes an increase of 13,622,753 (+38.80%) unique IP Addresses observed.
The IPv6 data shows the relative growth of this Internet topology from 2017 to 2020. The net change in the number of IPv6 ASes was 1,691 (+16.02%), a 13,264 (+32.28%) increase in AS Links, and a net increase of 361,733,728 (+62.51%) IPs from 2017 to 2020.
This work was supported by the USA National Science Foundation (NSF) under grants CNS-1513283 and CNS-1414177. and by the Department of Homeland Security (DHS) Science and Technology Directorate, Cyber Security Division (DHS S&T/CSD) N66001-12-C-0130 and HHSP233201600010C. The work represents the position of the authors and not necessarily that of NSF, DHS or DRDC.
For more information about the topology mapping project, see: https://www.caida.org/projects/macroscopic/
For details on a more sophisticated methodology for ranking AS interconnectivity, based on inferring AS relationships from BGP data, see CAIDA’s Introduction to Relationship-based AS Ranking at https://www.caida.org/catalog/datasets/as-relationships/.
Poster
Acknowledgments
CAIDA Topology Mapping Analysis Team: Donald Wolfson, Brad Huffaker, kc claffy
Software Development: Young Hyun, Matthew Luckie, Alex Marder, Bradley Huffaker, Amogh Dhamdhere
Poster Design: Melissa Hernandez