

A Day In The Life of the Internet: A Summary of the March 18-19, 2008 Collection Event
Executive Summary
To continue building the community and infrastructure to document A Day In The Life (DITL) of the Internet, CAIDA performs coordinated data collections with the ultimate goal of capturing a data set of strategic interest to researchers. On March 18-19, 2008, CAIDA and the DNS Operations, Analysis, and Research Center (OARC) coordinated the second 48-hour Internet measurement collection event comparable to the January 2007 event. Continuing to act on the recommendations of the National Academy of Sciences report "Looking over the Fence at Networks: A Neighbor's View of Networking Research (2001)", CAIDA and OARC, supported by the National Science Foundation as well as participants, completed a third broad-reaching coordinated collection event and delivered an unprecedented data set that provides a strategic glimpse into a typical day in the life of the Internet. On March 18-19, 2008, dozens of organizations around the world participated in a 48-hour Internet measurement collection event comparable to the January 2007 event. Although participation is greatly handicapped by legal and perceived competitive threats to sharing data, we achieved more than twice the participation of 2007. To maximize progress in the face of a thin budget and even thicker privacy barriers, we focused on one of the core components of the Internet infrastructure: the Domain Name System (DNS), and in particular the root name servers and TLD servers who had resources to participate in the data collection. We had 11 out of 13 root name server operators participate, 5 TLDs including .org, two registries, and several other DNS operators at different points in the hierarchy. We also conducted a survey of DNS open resolvers across routed IPv4 address space. The contribution of non-DNS data increased impressively as well. We had traffic traces from a commercial backbone, regional research networks, and universities, topology data from CAIDA's Ark project, BGP data from CERT, and netflow from a research network in Spain. Internet2 provided several types of data for its backbone. Both the similarities and the differences with last year's data are rich with insights about the state and evolution of the Internet, only a few of which we have extracted. We provide details on the set of participants and the type of data contributed this year, and review some preliminary lessons learned. We hope to encourage others to investigate this largest simultaneously collected research data set of critical Internet infrastructure ever made available to researchers (yes you have to sign AUPs to get the data).
The Participants and the Data
As in 2007, the bulk of the 2008 data came in the form of passive traces from root-level DNS servers (doubling last year's participation). Additional DNS data were provided by five top level domains, two regional registries, six AS112 nodes, two open root server nodes, and two caching resolvers. Several sites contibuted traffic traces captured on major campus and transit links as well as netflow and BGP routing data. We understand the effort and resources required to conduct this experiment and extend truly heartfelt thanks to the participants listed in the table below.
| Data | Participant |
|---|---|
| DNS queries to root servers | a.root-servers.net, operated by Verisign. |
| c.root-servers.net, operated by Cogent. | |
| e.root-servers.net, operated by NASA. | |
| f.root-servers.net, operated by ISC. | |
| h.root-servers.net, operated by United States Army. | |
| old-j.root-servers.net, operated by Verisign. | |
| k.root-servers.net, operated by RIPE NCC. | |
| l.root-servers.net, operated by ICANN. | |
| old-l.root-servers.net, operated by ICANN. | |
| m.root-servers.net, operated by WIDE. | |
| b.orsn-servers.net, operated by Lynix.net | |
| m.orsn-servers.net, operated by Home of the Brave GmbH. | |
| DNS queries to TLD servers | .BR, operated by Registro.br. |
| .CL, operated by NIC Chile. | |
| .ORG, operated by Afilias. | |
| .SE, operated by iis.se. | |
| .UK, operated by Nominet. | |
| in-addr.arpa (RIR) | Asia Pacific Network Information Centre (APNIC) |
| Latin American and Caribbean Internet Address Registry (LACNIC) | |
| Queries to AS112 servers | 8086 Limited |
| Afilias | |
| Internet Systems Consortium (ISC) | |
| Nautilus Mediterranean Exchange Point (NaMeX) | |
| Neutral Internet Exchange of the Czech Republic (NIX.CZ) | |
| Qwest | |
| Widely Integrated Distributed Environment (WIDE) | |
| Survey of Open Resolvers | CAIDA and The Measurement Factory |
| Caching Resolvers | Internet Systems Consortium's (ISC) Security Information Exchange (SIE) (link not available) |
| University of Rome (Italy) campus | |
| Passive Internet link traces | CAIDA/Equinix |
| CAIDA/UCSD Backscatter | |
| Widely Integrated Distributed Environment (WIDE) | |
| University of Southern California's Information Sciences Institute (ISI), LANDER project | |
| Korea Advanced Institute of Science and Technology (KAIST) | |
| Pohang University of Science and Technology's (POSTECH) Distributed Processing & Network Management Laboratory | |
| Active Measurements | CAIDA ongoing IPv4 Routed Topology measurement project |
| Other Measurements | Spanish Academic Network provides netflow data. |
| CERT.ORG provides BGP feeds. | |
| Internet2 provides netflow, BGP RIB updates, syslogs, and link utilization. |
Resources permitting, CAIDA also would like to integrate into the DITL collection the data from University of Oregon Route Views Project obtained on March 18-19, 2008 during the period of DITL measurements. Route Views provides real-time information about the global routing system from several different backbones and locations around the Internet. The project makes Cisco BGP RIBs and updates collected from participating routers in MRT format available to the public via anonymous ftp (or http) on ftp://archive.routeviews.org/.
Data Access
Access to the DITL experiment data varies based upon the policies of each collecting organization and the intended use of the data.
- DNS Related Data
The OARC hosts the DNS Root Nameservers, Top Level Domains, IN-ADDR.ARPA (RIR), AS112, Open Root Server Network (ORSN), and caching resolver traces. The OARC makes this data available via membership and the Data Access Agreement. For each participating node, OARC stores the original data files (in compressed pcap package/format) on OARC servers.
- Open Resolvers Survey
CAIDA and The Measurement Factory make the Open Resolver Survey results freely available to the public. We report open resolvers on the DNS Survey: Open Resolvers page which links to an archive of daily reports showing the number of open resolvers for each Autonomous System number as well as the most recent report.
- Passive Traces
- CAIDA and Equinix Anonymized OC192 transit Link Headers 2008-03-19.
Anonymized passive traffic traces from CAIDA's equinix-chicago monitor. CAIDA intends to make this data available to academic, government and non-profit researchers and CAIDA members.
- CAIDA Denial-of-Service attack backscatter data collected by the UCSD Network Telescope.
The telescope is a continous collection system that monitors malicious events such as Denial-of-Service (DOS) attack backscatter, Internet worms, and host scanning. CAIDA indexed the DOS backscatter metadata for the March 2008 DITL collection dates in DatCat. Researchers can find more information on the Backscatter 2008 Dataset page and can request access via the Backscatter Data Request Form.
- WIDE-TRANSIT packet traces 150 Megabit Ethernet link @ Tokyo, Japan.
WIDE collected traces in both directions on a 150 Megabit Ethernet external link which connects the WIDE backbone and its upstream provider. WIDE makes available packet header traces with a short payload as well as anonymized packet header traces without payload. Anonymized versions of the traces without payload are publicly available at http://mawi.wide.ad.jp/mawi/samplepoint-F/20080318/. Access to the original traces is restricted Please send requests for the data to kjc at wide.ad.jp .
- USC/ISI LANDER-DITL Anonymized packet headers from Los Nettos links.
This is a collection of packet headers captured on Los Nettos links within USC/ISI Lander project. The Los Nettos project makes these traces available via the PREDICT data archive.
- KAIST-KOREN 1 Gigabit Ethernet Trace 2008-03-18.
Access restricted. Only KAIST staff can access the trace files. People outside KAIST can gain access to shared results only indirectly by providing implementation code for KAIST staff to run on the dataset. For more information, please send email to chonkn at gmail.com.
- KAIST-Hanaro Packet trace 2008-03-18.
Access restricted. Only KAIST staff can access the trace files. People outside KAIST can gain access to shared results only indirectly by providing implementation code for KAIST staff to run on the dataset. For more information, please send email to sbmoon at cs.kaist.ac.kr .
- POSTECH-KT 1 Gigabit Ethernet Trace 2008-03-18.
Access to the original data files is restricted. Please send requests for the data to jwkhong at postech.ac.kr .
- CAIDA and Equinix Anonymized OC192 transit Link Headers 2008-03-19.
- Active Measurements
CAIDA provides its ongoing IPv4 Routed /24 Topology Dataset available to academic, government and non-profit researchers and CAIDA members.
- Other Measurements
- Universidad Autónoma de Madrid National Research and Education Network DNS Netflow Data (UAM.ES).
The Universidad Autónoma de Madrid captured two days of DNS Netflow data at a sampling rate of 1/400 packets. CAIDA hosts these netflow datasets and intends to make this data available to the public.
- The CERT Coordination Center (CERT/CC) BGP Routing Tables.
CERT.ORG captured 'show ip bgp' dumps from various routers across the Internet. Access to this data at the time of writing has not been specified, however, CAIDA intends to make this data available to academic, government and non-profit researchers and CAIDA members..
- Internet2 Netflow, syslogs of core routers, RRDs of link utilization, BGP routing tables.
Internet2 makes publicly available the syslogs of Internet2's core routers, RRD files showing link utilization, and BGP RIB updates for Internet2 core routers. Internet2 provides these descriptions of their network research data.
- Universidad Autónoma de Madrid National Research and Education Network DNS Netflow Data (UAM.ES).
The Metadata
For proper data curation, we encourage participants to record and document not only the tools and methodology (e.g. tcpdump) used to collect their data but specific options and local machine configurations. For the March 2008 event, CAIDA provided a how-to document a data collection page with recommendations for comprehensive metadata descriptions of collected datasets.
To increase access to currently existing Internet datasets, CAIDA developed DatCat: the Internet Measurement Data Catalog thus providing data documentation infrastructure to the Internet research, operations, and policies communities. The catalog lets researchers find, cite, and annotate data. We intend DatCat to facilitate searching and sharing of data and advance network science by promoting reproducible research.
We aim to index all the data collected during the DITL collection events in DatCat. In particular, for each DITL dataset, we plan to store the following basic attributes: file names, sizes, long and short descriptions, keywords, md5 hash value, gzip and tcpdump test flags, first and last packet timestamps, maximum length of the packets, maximum capture length, counts of packets captured and truncated, and clock skew. For specific traces, such as those captured at the dns root servers, we also record the server node name, counts of DNS queries and replies, counts of destination and source addresses of queries.
DatCat provides means to organize similar or related datasets into larger data collections. Therefore, in addition to individual dataset descriptions, the catalog may include metadata that describe relationships between datasets, the motivation for and peculiarities of each data collection, related publications, formats used, contacts and data access information, as well as recommended data citation style.
Coverage
The goal for DITL 2008 was to collect 48 continuous hours worth of data. To be safe, most participants began their collection at least one hour before the start of the specified collection period, and stopped one hour after its end. However, for various reasons (see Missing Data below) some participants did not capture data for the entire experiment duration. Figure 1 shows the periods covered by the sites that uploaded their collected data to OARC.
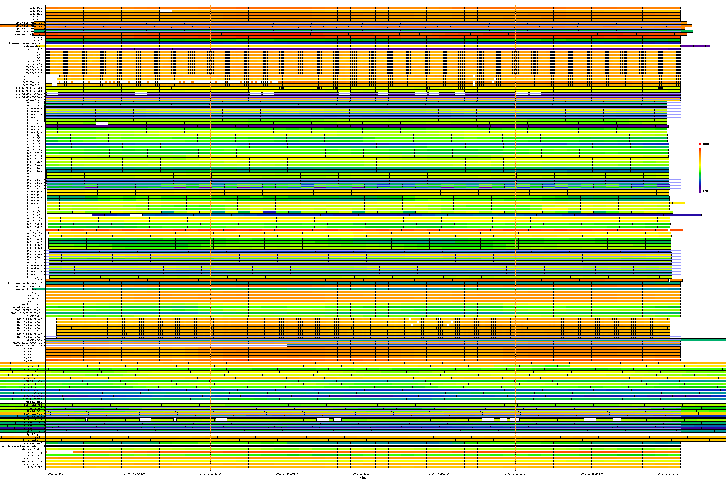
Figure 1 (click for larger image). Coverage of participating servers during a Day In the Life of the Internet experiment conducted March 18-19, 2008. The colors indicate the relative rate of queries received by the nodes with a range logarithmically scaled from low (blue) to high (red).
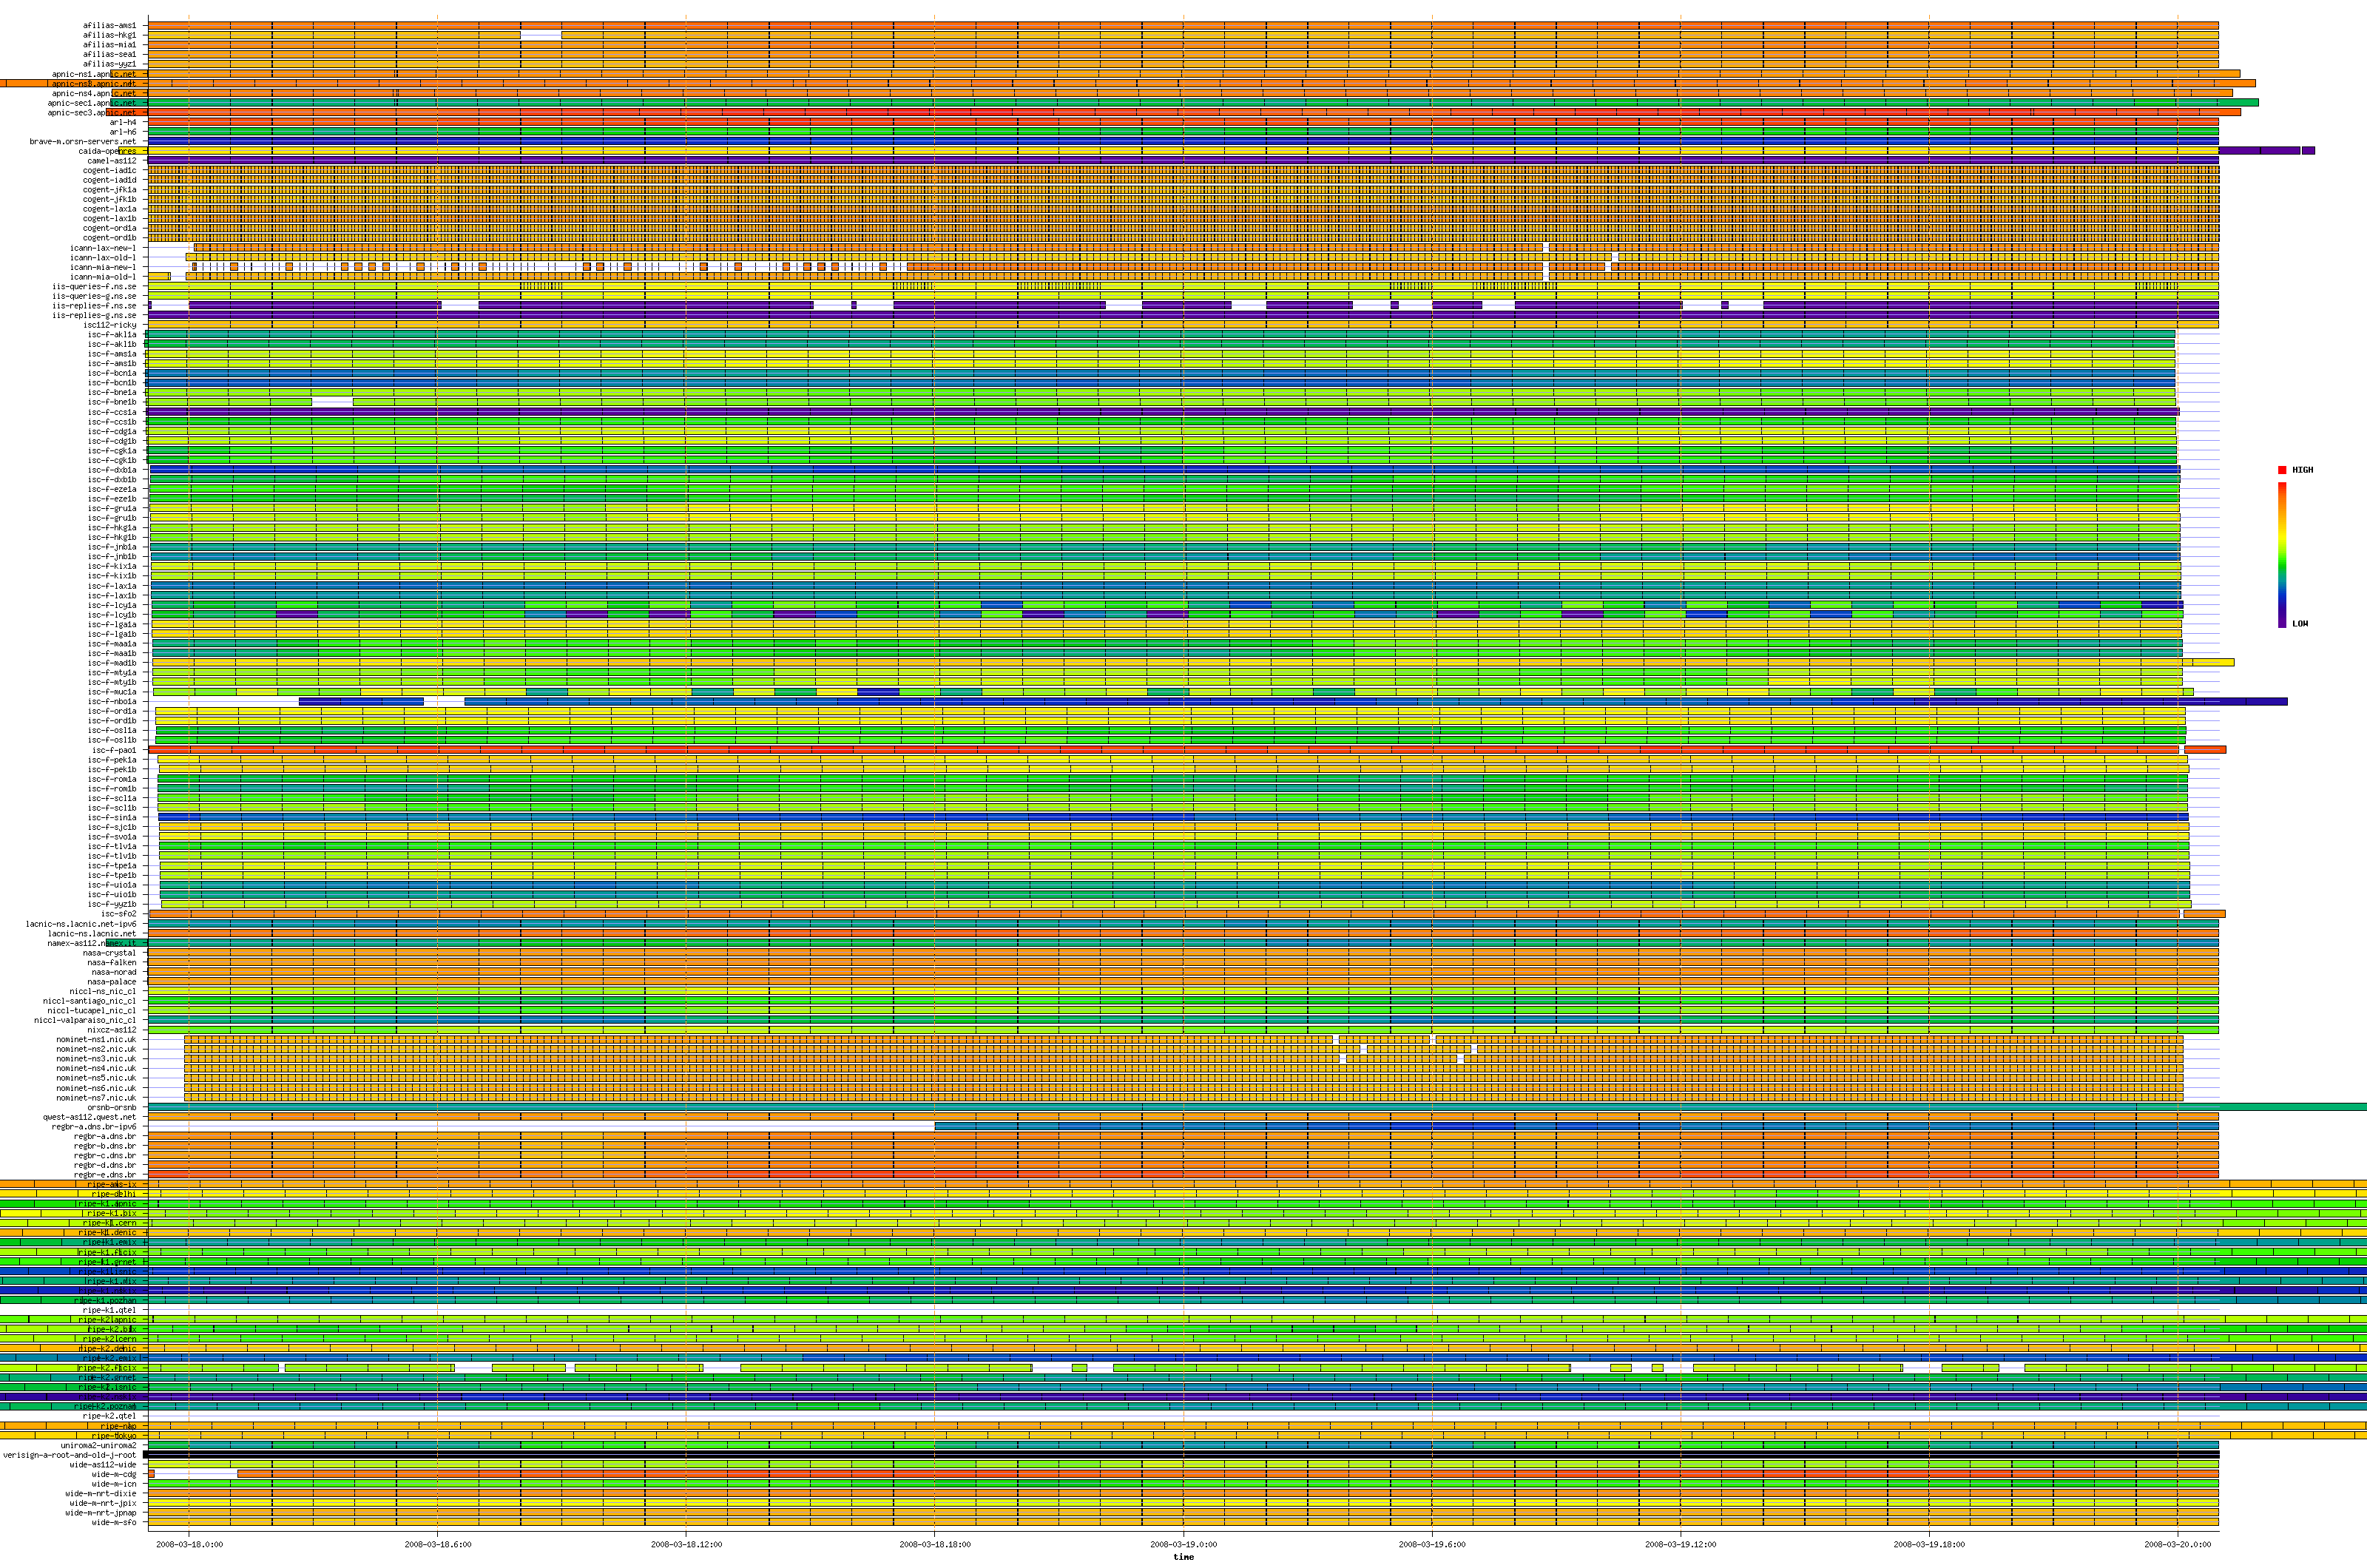
Ultimately, researchers choose for study the optimal 24-hour period where the majority of contributing sites captured data. This year, the best coverage was achieved on the second day of collection, the 24 hours from midnight (UTC) March 18, 2008 to midnight (UTC) March 19, 2008.
Missing Data
Despite the best efforts of all involved, some data was lost. We are aware of four reasons for lost or missing data:
- Not enough local storage. Many of the machines where data was collected were designed only for running the DNS server. They do not have a significant amount of local disk storage. The data could not be sent to the OARC server before running out of disk space.
- Not enough server storage. The server receiving the uploaded pcap files was underprovisioned at the start of data collection. It ran out of disk space, thus putting more strain on those participants with small amounts of local storage. In addition, the collection server crashed a number of times during data collection, leaving partial uploads in place.
- Time zone mistakes. It seems that at least one collection node was configured to use a local time zone instead of UTC. On this machine, the collection process was started via cron(8) or at(1). Since the time zone was wrong, collection began and stopped six hours too late.
- Human error. On the receiving side we mistakenly removed two pcap files while trying to fix some problems. One of these files was still held at the source and could be recovered; the other was lost.
Lessons in Data Management
This section reports on lessons we have learned regarding the logistics of data management when conducting large, distributed data collection events.
- Timing
Early notice increases the chances of participation. After much feedback last year regarding scheduling of the data collection experiment too close to the new year we shifted the date this year. It seems this change may have helped as we saw twice the participation in 2008 than we did in 2007. We hope to eventually support regular yearly collections, scheduled in advance, and will avoid holiday periods unless they are of strategic scientific interest.
- Ownership Management Techniques
The Data Supplier Agreement should be simple. Having a simple one-page "Data Supplier Agreement" to ensure confidentiality of data stored at OARC has worked well for signing up new participants.
- System Requirements, Planning, and Monitoring
Last year we learned how difficult it can be to transfer terabytes of data from various organizations and individuals around the globe running on many operating systems and network administration policies. This year we were well prepared with plenty of storage provisioned and tools to assist data collection sites.
- Plan for disk storage. It is good to ask contributors for a size estimate in advance, and check against available disk space on the upload servers. Ideally, submitters should do a similar exercise on their local data collection servers, particularly those who do not gather this data on an ongoing basis, and where the upload bandwidth from the collection servers is limited. For 2008, we estimated that we would receive about 2TB and decided to make sure we had at least twice that amount of available space.
- Conduct a dry-run of data collection as well as submission. Dry runs for 2008 were useful, but we should have done even better. There were problems during collection that we should have found during the dry run. In particular, we should have found clock skew problems and node-name collisions.
- Remind participants to adjust for local configuration. Remind all participants before future the experiment to either temporarily disable any auto-rotate scripts that delete data after an expiry period, or to copy older files to another location.
- Create a mechanism for participants to easily track upload status. We created an extremely useful web page of "file upload status" during the exercise, which we will definitely use for future collecting events. Another possible option is to give contributors sftp and/or shell access to verify and amend their uploads.
- Keep a log of MD5 checksums of files submitted. This year, we may have solved this problem by our software improvement that uses MD5 during the upload to make sure the file gets received correctly.
- Keep copies of data on collection site if space allows. The upload tool deletes files after upload on the assumption that local disk space is scarce. We should allow the upload tool to keep local copies of the data if there is sufficient space, just in case data is unexpectedly lost on the central server.
Priorities for Analysis of DITL Data
We highly encourage exploratory research and feedback on the DITL data! Thus far we have only completed preliminary analyses of the data ourselves, and offer the following priorities for those who do not already have their own questions they want to answer with the data:
- Automation and parallelization of data processing and analysis,
including computation of basic statistics:
traffic (e.g., application or query) types and rates; topological coverage; geographic characteristics; evidence of use of unallocated address space; and trends in these statistics across years.
- Extension of tools to process non-root server traces.
- Tracking heavy users, especially those that are sources of pollution to DNS servers.
Related Links
- What Researchers Would Like to Learn from the DITL Project: The Top Questions and Data Types
- DatCat: Internet Measurement Data Catalog
- DatCat: Day in the Life of the Internet, March 18-19, 2008 (DITL-2008-03-18)
- Operations, Analysis, and Research Center (OARC)
- Recommendations for future large scale simultaneous DNS data collections
- A Comparison of Traffic from the DNS Root Nameservers as Measured in DITL 2006 and 2007
- DITL 2008 Analysis
Appendix A: Pcap File Format and File Summary
Pcap Files
We asked participants to capture packet traces in "pcap" file format using tcpdump (or something similar). Since the amount of data is large, we suggested that pcap files should be split into reasonable sizes, such as one-hour long chunks. Table 1 summarizes the number and compressed size of pcap files received from the participants.
| Participant | Files | Bytes |
|---|---|---|
| afilias | 249 | 79,578,205,425 |
| apnic | 275 | 329,473,564,979 |
| arl | 100 | 53,917,171,157 |
| brave | 50 | 90,371,093 |
| caida | 54 | 3,014,897,296 |
| camel | 51 | 2,932,831 |
| cogent | 4808 | 182,972,413,862 |
| icann | 1196 | 52,848,692,482 |
| iis | 288 | 10,202,053,474 |
| isc | 3159 | 163,467,660,550 |
| isc112 | 50 | 5,393,270,029 |
| lacnic | 100 | 30,475,563,818 |
| namex | 51 | 121,634,521 |
| nasa | 200 | 78,550,475,864 |
| niccl | 200 | 2,322,682,461 |
| nixcz | 50 | 683,308,327 |
| nominet | 2017 | 161,159,738,725 |
| orsnb | 5 | 514,117,333 |
| qwest | 50 | 11,471,333,792 |
| regbr | 281 | 241,061,606,671 |
| ripe | 2428 | 96,395,497,609 |
| uniroma2 | 50 | 530,351,923 |
| verisign | 5258 | 303,756,023,029 |
| wide | 349 | 277,524,710,236 |
| All | 21319 | 2,085,528,277,487 |
Table 1. The number and compressed size of pcap files received from the participants.