

IPv4 and IPv6 AS Core: Visualizing IPv4 and IPv6 Internet Topology at a Macroscopic Scale in 2005
The current Internet network layer protocol - Internet Protocol version 4 (IPv4) - has been strained by the rapid growth of the Internet. Many regions of the world are beginning to transition from IPv4 to Internet Protocol version 6 (IPv6) to solve some of IPv4's limitations. The transition has been underway since 1997, with the IPv6 Internet coexisting with the IPv4 Internet.
<Since 2000, CAIDA has generated AS Core graphs -- Internet Topology Maps also referred to as AS-level Internet Graphs -- in order to visualize the shifting topology of the Internet over time, as can be seen in the historical view.
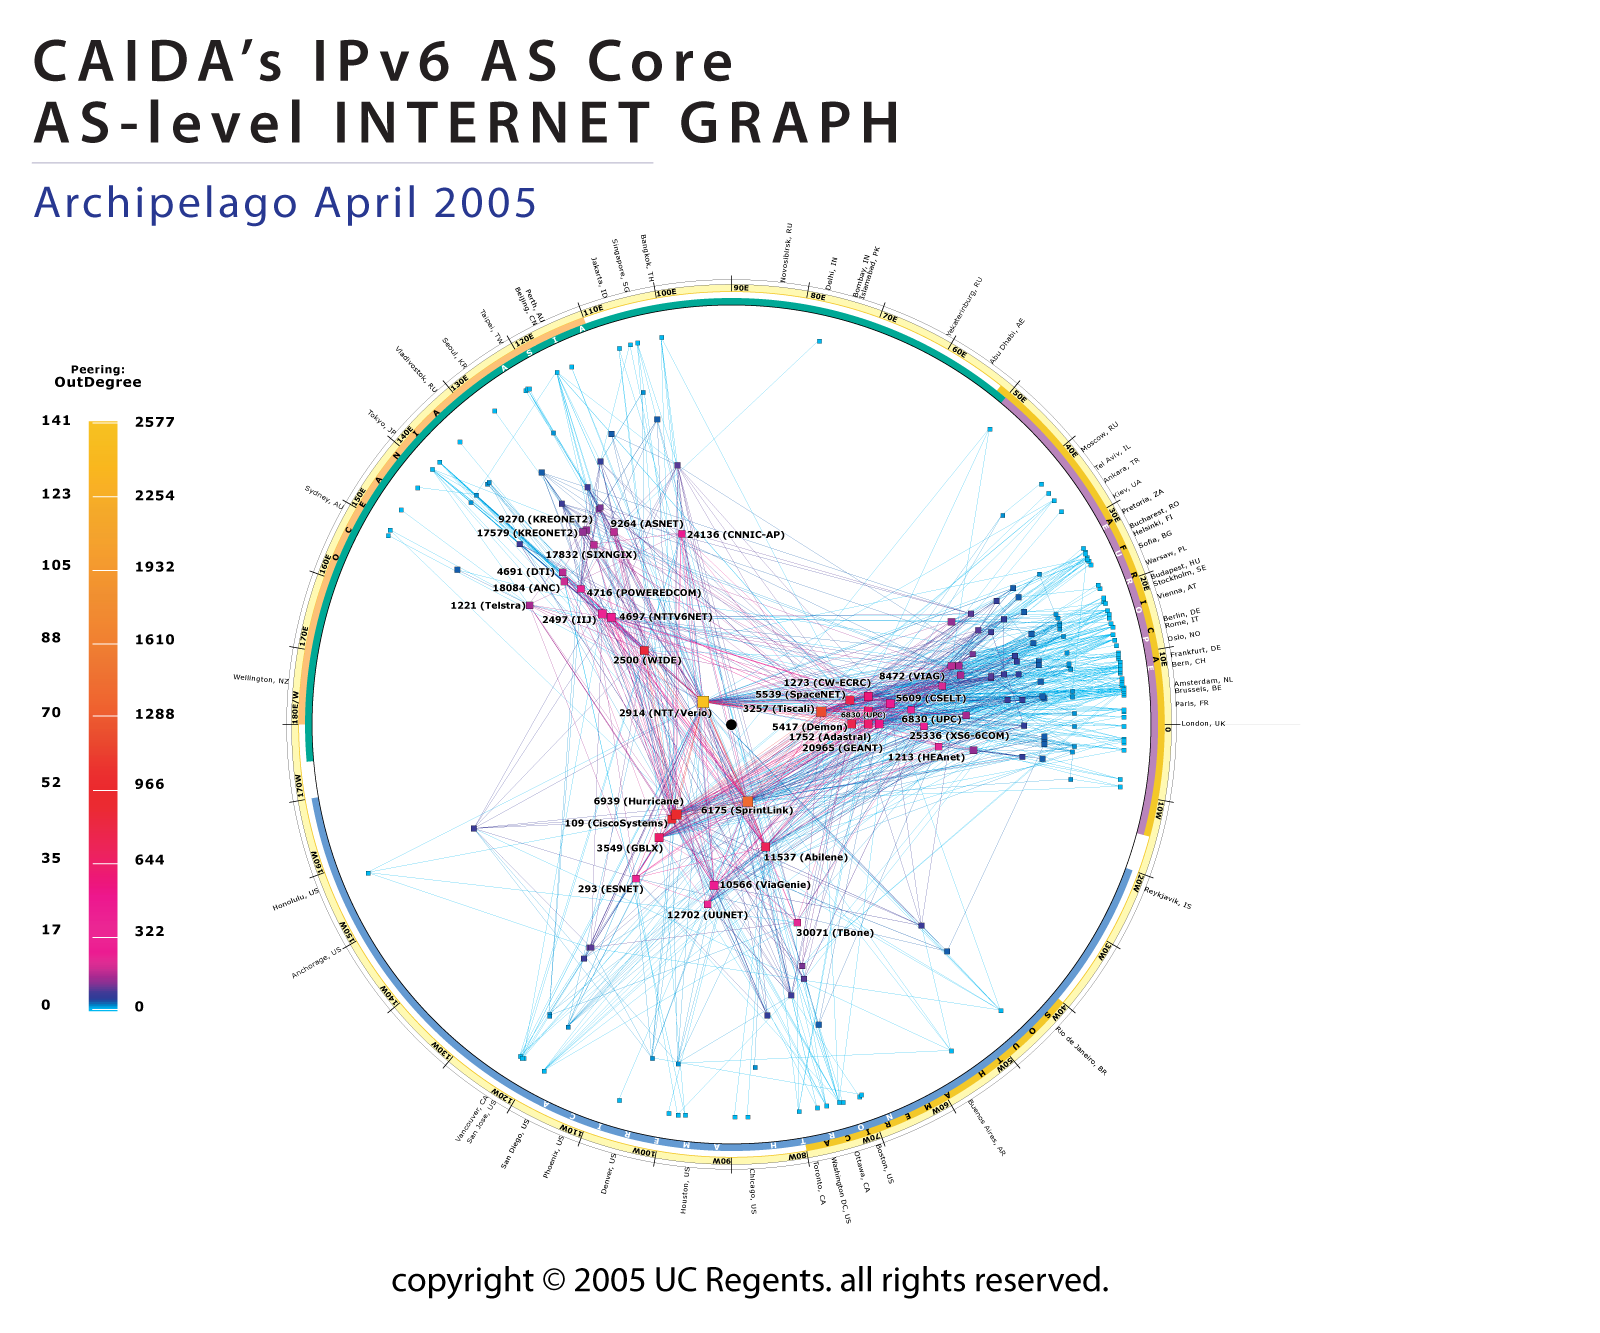
Here we present a visualization of the AS-level IPv6 topology as observed on March 4th, 2005.
Data
This visualization represents a macroscopic snapshot of the IPv6 Internet topology collected around March 4th, 2005. Topology data gathered from 17 monitors probing approximately 860 globally routable IPv6 network prefixes include 2,913 IPv6 addresses and 7,905 IPv6 links (immediately adjacent addresses in a traceroute-like path).
We aggregate this view of the network into a topology of Autonomous Systems (ASes). Each AS approximately corresponds to an Internet Service Provider (ISP). We map each IPv6 address to the AS responsible for routing it, i.e., to the origin (end-of-path) AS for the IPv6 prefix representing the best match of this address in Border Gateway Protocol (BGP) routing tables. We use the largest publicly available set of core BGP routing tables, collected by RIPE. The resulting abstracted AS graph consists of 333 Autonomous System (AS) nodes and 1,304 AS-links (peering sessions).
Layout
 The position of each AS node is plotted in polar
coordinates, position(radius, angle) or pos(r,
The position of each AS node is plotted in polar
coordinates, position(radius, angle) or pos(r,
![]() ) calculated using the equations in the box below.
The outdegree of an AS node is the number of `next-hop'
ASes that were observed accepting traffic from this AS.
The link color reflects outdegree, from lowest (blue) to highest (yellow),
Some ISPs toward the center have been manually labeled.
A complete description of the layout algorithm can be found
main webpage.
) calculated using the equations in the box below.
The outdegree of an AS node is the number of `next-hop'
ASes that were observed accepting traffic from this AS.
The link color reflects outdegree, from lowest (blue) to highest (yellow),
Some ISPs toward the center have been manually labeled.
A complete description of the layout algorithm can be found
main webpage.
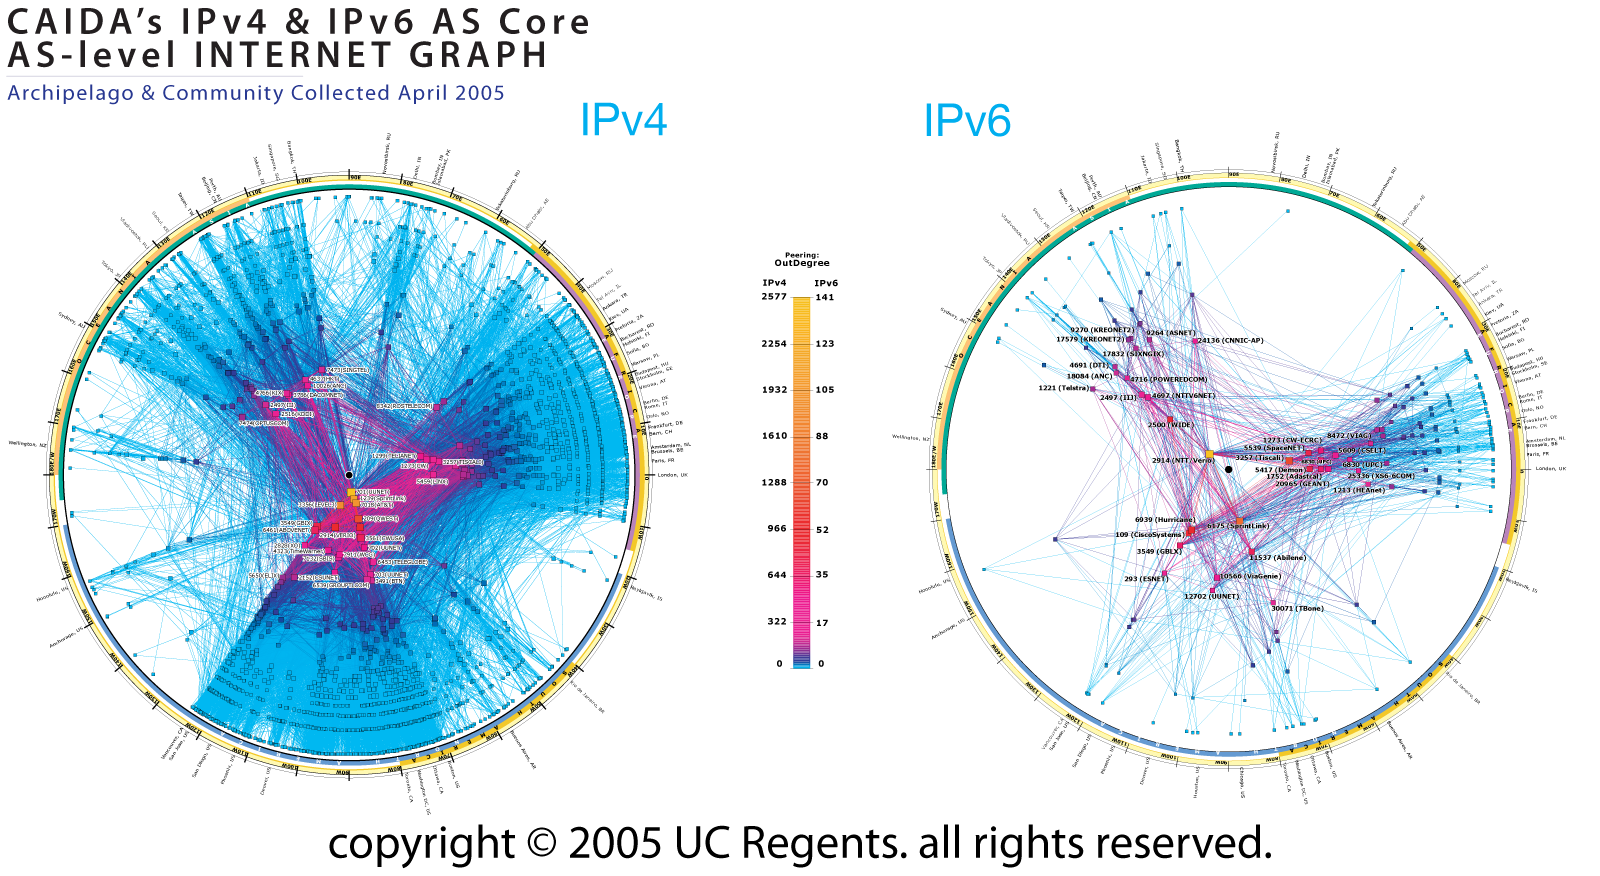
Comparative Analysis
Of the dominant ASes in the IPv4 AS graph, only SprintLink and UUNET are near the core in the IPv6 graph, and only SprintLink shows rich IPv6 connectivity. This disparity is consistent with the U.S. industrial attitude toward IPv6 as still more experimental rather than operational reality.
Caveats
This visualization does have some limitations:
- The headquarters of an AS reflects only an administrative home, not geographical location, of actual infrastructure, which is often national or global.
- Some organizations administer multiple ASes, although usually there is a one-to-one mapping between an AS and a network organization.
- The IPv6 graph does not reflect current conditions, only a snapshot taken on March 4th 2005. More measurement and analysis are needed to determine an appropriate sampling rate.
- The graphs only represent forward IP topology information, with IP addresses mapped to origin ASes using a BGP routing table. Other information about peering sessions or complete route maps is not reflected.
- The graphs reflect the IP layer only, and do not capture lower layer (e.g., ATM, physical fiber) information.
- The graphs do not address any performance or workload measurements, precluding comparison of ISPs in these dimensions.
- Nodes may be located on the outer rim even though they have many links, because their AS outdegree is zero.
Acknowledgments
CAIDA Topology Mapping Analysis Team:
Bradley Huffaker, Andre Broido,
Marina Fomenkov, Young Hyun, Dan Andersen, Ken Keys,
David Moore, kc claffy.
Scamper software developer: Matthew Luckie
Monitors:
Peter Bieringer (Deep Space 6),
Bill Cerveny (Internet2),
Kenjiro Cho (IIJ/WIDE),
Dave Burke (EsatBT),
Gert Doering (SpaceNet),
John Hicks (Indiana University),
Daniel Lawson (WAND),
Pav Lucistnik (Czech On Line),
David Malone (TCD+NUIM, Ireland),
George Michaelson (APNIC),
Bill Owens (NYSERNet),
Paul Vixie (ISC-OARC)