

iLENS: Proposal
An abbreviated version of the original proposal is shown below. For the full proposal for "CRI-ADDO-EN: Internet Laboratory for Empirical Network Science (iLENS)", please see the iLENS proposal in PDF.
Sponsored by:
")
Principal Investigator: kc claffy
Funding source: CNS-0958547 Period of performance: March 1, 2010 - February 28, 2014.
1 Overview: Internet Measurement
We now critically depend on the Internet for our professional, personal, and political lives. This dependence has rapidly grown much stronger than our comprehension of its underlying structure, performance limits, dynamics, and evolution. Fundamental characteristics of the Internet are perpetually challenging to research and analyze, and we must admit we know little about what keeps the system stable. As a result, researchers and policymakers deal with a trillion-dollar ecosystem essentially in the dark, and agencies charged with infrastructure protection have little situational awareness regarding global dynamics and operational threats. To make matters worse, the few data points available suggest a dire picture, shedding doubt on the Internet's ability to sustain its growth and role as the world's communications substrate. Situational awareness and architectural innovation face the same obstacles as empirical Internet science: cost of technology deployment; radically distributed ownership of constituent parts; and an operational climate that generally disincents sharing data. With previous NSF (CRI), DHS, and non-government sources of funding, we have been able to design, implement, deploy, and operate - a relatively small but secure infrastructure and operating system platform that supports large-scale active measurement studies of the global Internet. We propose to upgrade and extend - in geographic scope as well as function - this active measurement instrument (Ark [1]) to provide academic researchers a laboratory in which to quickly design, implement, and easily coordinate the execution of experiments across a widely distributed set of dedicated monitors. More importantly, we have demonstrated - and now wish to operationalize - the ability for this infrastructure to serve other researchers undertaking macroscopic studies of the Internet. Our first two experiments with external use of the infrastructure resulted in publications in the (premier in our field) Internet Measurement Conference in 2008 and 2009. In 2008 we worked with the University of Waikato to use Ark to assess the relative performance and efficiency of various topology probing methods, the results of which informed our own topology probing configuration. In 2009 we supported the MIT spoofer analysis project [2] by deploying traffic listeners at Ark monitors, which collected UDP probes from spoofer test clients, and forwarded the traffic to an MIT server for analysis of the extent of `spoofable' networks, i.e., networks configured to allow IP packets with forged source addresses to reach the global Internet (giving haven to attackers). Our top infrastructure development priorities are: (1) add monitors in geographic and topological areas we lack coverage; (2) improve tools for processing raw topology data, to enable an unprecedented range of Internet mapping research while reducing the burden on individual researchers and students to achieve results; (3) enhance and develop new software modules to support new types of experiments and validation. We propose to conduct annual workshops to collect, synthesize, and plan implementation of feedback on infrastructure operation. Section 2 describes the infrastructure and architecture of the Archipelago (Ark) system, including deployment status, features, and limitations, as well its relationship to other Internet mapping efforts. Section 3 reviews projects that Ark monitoring and data infrastructure support. Section 4 presents our proposal for turning Ark into a more powerful Internet science laboratory to support national as well as global needs. Section 5 provides examples of research activities enabled by Ark. The remaining sections describe proposed workshops project performance metrics, team qualification, and management plan.2 Archipelago active measurement platform
2.1 Easy development and rapid prototyping
Easy development and rapid prototyping are important factors, not only in increasing productivity, but in how they promote discovery. By lowering the cost in time and effort needed to implement a measurement idea, a researcher can explore more experimental and risky ideas (which may have a high return) and increase the sophistication of implemented techniques. These benefits will hopefully lead to better and more useful measurements. Ark supports rapid prototyping by promoting software development at a high-level of abstraction using dynamic scripting languages and pre-built API's and services. We adopt Ruby [19] as the primary implementation language for measurements and create libraries tailored for topology measurements. In particular, we provide a library for controlling all aspects of the scamper [20] topology measurement tool from a Ruby script (Section 3.1 has details on scamper). By interacting with scamper over a network connection, a client can control and steer its measurements. In this arrangement, scamper acts as the general-purpose measurement engine, handling the details of efficiently parallelized traceroute, ping, and more sophisticated measurements such as alias resolution and load-balanced multipath enumeration [21]). A user's Ruby script commands the process, selecting targets, frequency, and specific kinds of measurements. Although scripting is the preferred mode of development, Ark does not preclude low-level development work using languages like C or C++, or the direct execution of stand alone measurement tools. We also hope to provide a high-level API for direct packet generation, capture, and analysis, taking inspiration from efforts such as Scriptroute [22], Metasploit Framework [23], and Scapy [24].2.2 Dynamic and coordinated measurements
At its simplest, a measurement infrastructure executes a pre-configured set of measurements to a static set of targets. However, many desirable measurements require dynamism and coordination among measurement nodes. For example, we may want to estimate path diversity within a given announced network segment (prefix), and we could find it out by using a set of monitors to probe the prefix in a binary-search pattern, continually subdividing the prefix until we no longer observe path diversity. As another example, we may want to monitor a set of target prefixes, e.g., containing some critical infrastructure, with low frequency pings and traceroute, and then trigger more comprehensive measurements from many vantage points upon detection of unreachability or path change (to detect prefix hijacking, for instance) [25]. A distinguishing feature of Ark is its focus on coordination - planning, executing, and controlling an ensemble of distributed computations [26,27]. Coordination allows the heterogeneous pieces of a measurement infrastructure to work efficiently toward a common task. To enable coordination, Ark employs a new implementation, called Marinda, of the tuple-space coordination model first introduced by D. Gelernter in his Linda coordination language [28,29]. A tuple space is a distributed shared memory combined with a few easy-to-use operations. The tuple space stores tuples, which are arrays of simple values (strings and numbers), and clients retrieve tuples by pattern matching. When acting as a communication channel, the tuple space supports one-to-one and many-to-many communication. Decentralized measurement processes execute autonomously at each monitor, communicating as needed, for example, to trigger further measurements or analyses based on locally observed events. Because the tuple space abstraction is easy to use, and the implementation shields client software from complexities of network communication and faults, Ark lowers the barrier to deploying sophisticated distributed measurements. The tuple space also provides shared state, which allows for decoupling of measurement processes in time and space. That is, processes reading and writing to the tuple space can have non-overlapping lifetimes (decoupling in time) and need not know the identity, location, or even existence of each other-tuples are not addressed to a recipient (decoupling in space). These qualities allow dynamically changing, open-ended sets of participants over the course of each experiment and the ability to decompose a complex measurement task into phases (by storing intermediate results in the tuple space) or into a cooperating set of processes having distinct duties.2.3 Measurement services
Another distinguishing feature of Ark is its support for measurement services. We want to make it easy for researchers to use and to build on the work of others at the granularity of services. This approach has already taken hold on the Internet in the form of web services, technologies like XML-RPC and SOAP, and in enterprise systems in the form of the service-oriented architecture (SOA). In Ark, this built-in support for services is enabled by the tuple space, a unified mechanism for transport and messaging (in the terminology of the web services protocol stack). More concretely, a user can easily deploy a measurement service by simply writing a program that interprets tuples as commands, performs some measurement, and returns the result as a tuple. To illustrate the power of this abstraction, we have implemented a traceroute and ping service that runs on each deployed monitor. With this service, a user connected to any node in the infrastructure can easily initiate ad-hoc, on-demand measurements from any local or remote monitor. We are using the same approach to implement support services, such as to: (1) map IP addresses to prefixes and ASes, (2) randomly generate a destination matching some criteria, (3) check destinations against a system-wide no-probe list, and (4) choose a vantage point based on monitor attributes such as location and capabilities.3 Projects now supported by the Ark infrastructure
In this section we highlight the Ark infrastructure's six major contributions to Internet science thus far: (1) a comprehensive longitudinal dataset of macroscopic IP topology data, annotated with operational characteristics, with associated services to help interpret or process the raw data; (2) regular updates of annotated AS-level graphs; (3) a rigorous comparison of the effectiveness of Internet topology probing methods, which directly informed future measurement; (4) the first macroscopic IPv6 active measurement topology data set ever made available to researchers; (5) a study of the effectiveness of IP address alias resolution methods in constructing accurate Internet router-level maps; (6) a network hygiene assessment of how many networks allow forged packets to exit or transit their infrastructures. Section 4 describes how we will enhance some of these projects, as well as provide support for new types of experiments on the Ark infrastructure.3.1 Annotated macroscopic IPv4 topology data
The Ark infrastructure collects our most comprehensive and scientifically generative active data set - the IPv4 Routed /24 Topology Dataset [30] - by systematically measuring IP-level paths to a dynamically generated list of IP addresses covering all /24 prefixes in routed IPv4 address space. In July 2009 alone, we collected nearly 300 million traceroutes in 119 GB of traces. Over the lifetime of Ark, from Sep 2007 to present, we collected more than 4 billion traceroutes in 1.6 TB of traces. For scalability, resilience, and etiquette, we group monitors into 3 teams of about 13 monitors each and use the Marinda tuple space to dynamically distribute measurement tasks among team members. This parallelization allows us to obtain a traceroute measurement to each routed /24's (i.e., the full routed address space subdivided into /24's, or 7.4 million /24's) in about two days. We perform traceroute measurements using Matthew Luckie's scamper , a flexible active measurement tool supporting IPv4, IPv6, traceroute, and ping. Scamper implements TCP-, UDP-, and ICMP-based traceroute measurements, including the Paris traceroute variants [31,32]. Our experiments now use ICMP Paris traceroute,which a recent Ark-supported experiment (described in section 3.3) found to be the most effective topology probing method [33].3.1.1 DNS annotations
In response to requests from users, we now execute DNS lookups of all IP addresses seen in the IPv4 Routed /24 Topology Dataset. We use a customized bulk DNS lookup service that is capable of millions of DNS lookups per day. We attempt DNS lookups as soon as possible after we collect topology data (within 1-2 days) so that the DNS meta-data better matches the state of the Internet at trace collection time. This collection system yields two datasets: 1) a simple IP-to-hostname map and 2) raw DNS query/response traffic generated by the lookup service. The first dataset is useful for annotating IP topology data with information commonly encoded in router names, such as geographic location, link capacity, router type (access vs. backbone), and customer network name. The second dataset is useful for studying characteristics of DNS name servers, such as the penetration of DNSSEC and IPv6. Rigorous analysis of the data might reveal other information, such as organizational relationships (backup nameservers can reveal trust and/or hierarchy). Because we probe every routed /24, this DNS traffic dataset includes a broad cross-section of operational DNS name servers, and likely reveals robustness characteristics of this critical layer of the Internet architecture, such as extent of redundancy or consolidation over time.3.2 Derived strategic data sets: router-level and AS-level IPv4 Internet graphs
To satisfy researcher requests for topology data already converted to more usable granularities for modeling, we have developed services that automatically convert raw IP data to AS-level data, and will soon be able to convert raw IP data to router-level data. We note that both of these transforms pose methodological difficulties, which we detail in this section. We try to implement and support the best techniques in the field to get a broad range of researchers the best available Internet topology data possible.3.2.1 Alias resolution to construct router-level maps
The traceroute data described in section 3.1 is a collection of traces, i.e., sequences of IP addresses. Reconstructing the router-level topology from this data requires grouping IP addresses belonging to the same router. This grouping process is called alias resolution, and it is essential to accurate characterization of Internet topology at the router level. Alias resolution is a notoriously hard problem, with the greatest challenge being validation, because alias inferences must be compared to information that many network operators keep private for competitive business reasons. Yet there is tremendous demand by researchers for router-level topology data [18]. We already use the best known alias-resolution techniques on our topology data for a DHS project. We have looked into ways of improving the accuracy and scalability of existing alias-resolution techniques and ways of combining these techniques into a unified system that is greater than its parts. In particular, we have made improvements to the APAR [34] and RadarGun [35] techniques and made attempts at combining the APAR and Mercator techniques, as implemented in CAIDA's kapar and iffinder tools, respectively, as a step toward MAARS, the Multi-Approach Alias Resolution System [36,37]. By 2010, we hope to put into production the most successful combination of techniques on the IPv4 Routed /24 Topology Dataset, maximizing its utility to researchers of router-level maps. CRI funds would allow us to share our router-level topology data and to validate these alias-resolution techniques across a large cross-section of the Internet. We propose to address the validation problems by developing and deploying an easy-to-use web-based visualization/validation interface to our alias inferences that will lower the barrier for willing network providers to validate the data (see section 4). Since alias resolution is still an active area of research, we will also include as part of our workshop series (section 6) a session on comparing methods with a set of collected ground truth data, using a new tool we propose to build in section 4.2.3.2.2 AS-level Internet topology maps
From traceroute data we create another derived and increasingly popular data set: an AS-level topology map. Using BGP tables provided by Route Views [38], we map the IP addresses in gathered IP paths to the AS numbers that advertise the longest IP prefixes matching each IP address. If two consecutive IP hops in a trace resolve to different ASes, we interpret it as a link between these ASes. The set of these links constitutes an AS-level topology graph. As with alias inference, AS-level inferences are still an active and unresolved area of research [39], and mostly blocked on the same problem: validation against ground truth data. A particularly puzzling question regards the continual accumulation of AS links as inferred from all traceroute-based topology measurement projects. The AS graph also undergoes densification: the average degree increases. These unexplained (and questionable) growth characteristics imply the need - but no algorithm - to filter false AS links, as well as to determine the appropriate windowing interval to create a representative AS graph. We know a few minor causes of false AS link inference (the use of AS-sets, private ASes, multi-origin ASes [40]), some of which can be filtered out. But the discrepancy is greater than these BGP idiosyncrasies can explain. Continuous measurements also discover new IP addresses at a constant rate, for up to several months, due to BGP dynamics [41]. The link accumulation question remains open - and important - since even BGP topology measurement projects want to integrate (trusted) traceroute data [42]. Unfortunately, AS-level cartography is even more complex than router-level. Reproducing only the raw Internet topology is insufficient; useful modeling must also capture and reproduce node and link annotations [18]. Thus, as with our DNS annotations for IP addresses, we augment the AS-level graphs with annotations, categorizing links and nodes in ways that empirically ground as well as facilitate formal analysis of the graph. AS node annotations may label different types of ASes, e.g., large or small Internet Service Providers (ISPs), exchange points, universities, customer enterprises, etc. [43,44]. AS link annotations represent business relationships between AS nodes, e.g., customer-to-provider, peer-to-peer. To infer these AS relationships, we use techniques developed at CAIDA based on multi-objective optimization [45], which heuristically balances inference decisions to minimize known errors. We plan to operate Ark using the best available techniques for both router-level and AS-level inferences, and will focus a session of workshops on performance comparisons and deployment of innovations in these processes. But, also as with alias inference, methodological issues with AS-level inferences are only recently receiving dedicated research funding. It is the ideal time to enhance our infrastructure with three things that will help researchers make more efficient progress on these pivotal questions: comprehensive data sets, a baseline of ground truth data against which to validate, and making all raw data and scripts available for others to reproduce or improve.3.3 Enabled measurement science: probing method evaluation
We have demonstrated that researchers can use Ark to quickly design, implement, and easily coordinate the execution of experiments across a widely distributed set of dedicated monitors. Ark coordination facilities also assist researchers with data transfer, indexing, and archiving. Three researchers outside of CAIDA have succeeded in accomplishing Ark-enabled research. In early 2008 Matthew Luckie, a collaborator in New Zealand, used his scamper [20] tool on the Ark infrastructure to study which topology probing method is the most efficient in discovering the Internet topology. For example, do per-flow load balancers implement different forwarding policies for TCP and UDP? Archipelago provided a perfect platform for launching this comparison study, and we co-authored a paper for the IMC 2008 conference [33]. We found that ICMP-based traceroute methods tend to successfully reach more destinations, as well as collect evidence of a greater number of AS links. We also discovered that UDP-based methods infer the most IP links, despite reaching the fewest destinations. In 2009, Alistair King, a graduate student of Matthew Luckie, used Ark to implement and run the doubletree topology discovery algorithm [46] as part of his thesis work. Doubletree allows a set of monitors to more efficiently conduct large-scale topology measurements. The efficiency is achieved by avoiding redundant measurements of common topology segments near monitors and near destinations. The Marinda tuple space provided by Ark allowed quick implementation of the inter-monitor communication and coordination required for doubletree.3.4 Enabled measurement science: assessment of infrastructure vulnerabilities
IP source address forgery, or "spoofing," is a long-recognized attack vector resulting from the Internet's lack of packet-level authenticity. Despite over a decade of filtering and tracing efforts, attackers continue to utilize spoofing for anonymity, indirection, and amplification. In 2009 we collaborated with Rob Beverly to extend the scope of his MIT spoofer analysis project [2] to take advantage of multiple Ark's vantage points. Approximately 800 active measurement clients sent various types of spoofed traffic to Ark nodes. Ark nodes forwarded the traffic to the spoofer machines at MIT, enabling an unprecedented assessment of the prevalence of deployment of recommended network hygiene practices over a wide range of global routes (e.g., commercial, academic, etc), including path-based analysis and tomography. Ark made it possible to quickly expand the scope of the spoofer measurements from one measurement receiver at MIT to 30 Ark monitors. The greatest challenge in this expansion was the task of forwarding spoofer probes received by Ark monitors distributed worldwide to the analysis server at MIT. However, the Marinda tuple space allowed us to easily implement the near real-time forwarding of probes in a trivial amount of code (a handful of lines of code) and without the usual worries of implementing a custom communication layer that is robust to inevitable transient networking failures. The near real-time forwarding allowed the Spoofer project to provide immediate feedback to end users participating in the study, in the form of a dynamically-generated web page that the user can browse at the conclusion of his/her measurement run.1 The use of Marinda also opens the possibility of two-way command and control between the analysis server at MIT and the Ark infrastructure (arbitrary bidirectional communication is one way in which the tuple space abstraction is different from technologies like HTTP and XML-RPC). For example, the analysis server might trigger topology measurements on demand (via Ark's topo-on-demand service) to perform tomography. In our 2009 study, we found that 31% of clients were able to successfully spoof an arbitrary, routable source address while 77% of clients otherwise unable to spoof could forge an address within their own /24 subnetwork. We also uncovered significant differences in filtering depending upon geographic region, type, and size of network. The data revealed no improvement in this aspect of network hygiene over four years of measurement, and provided an empirical basis for evaluating incentive and coordination issues surrounding existing and future Internet packet authentication strategies.4 Proposed Infrastructure Development
We are in the early stages of an exciting project, and look forward to the Internet measurement infrastructure we have built getting substantial use by a broad cross-section of research communities. Our top infrastructure development priorities are: (1) additional monitors in geographic and topological areas we lack coverage; (2) improved tools for processing raw topology data, to enable an unprecedented range of Internet mapping research while reducing the burden on individual researchers and students to achieve results. (3) enhance and develop new software modules to support new types of experiments and validation. We propose annual workshops to collect, synthesize, and plan implementation of feedback on infrastructure operation (see Section 6). We will also create packages of data about connectivity, routing and latency gathered from a large cross-section of the global Internet, targeted for use in the classroom.4.1 New hardware to be acquired
We propose to deploy 8-10 new active measurement Ark monitors in each year of the project. We will also upgrade and/or replace existing monitors that fail or become obsolete. We hope to deploy more monitors in underrepresented areas like South America and Africa in order to obtain greater insight into the connectivity of these emerging economies. To meet the data needs for this project we will purchase a data server (dual-core 3GHz, 16 GB RAM, 2TB storage), a compute platform capable of handling complex computations on large AS and router-level graphs (quad-core 3GHz, 32GB RAM, 6TB storage) and a fast network switch to connect these devices to the rest of our infrastructure.4.1.1 Integration with existing infrastructure
The new monitors acquired with CRI funds will organically extend the capabilities of the existing Ark infrastructure and thus will increase the value of the significant investments already made into the infrastructure. We have well-developed and efficient processes for building, configuring, and deploying new monitors to locations throughout the world and for quickly integrating new nodes into ongoing measurement activity. Ark's current application footprint does not require substantial memory, disk, or computational resources. We do fine with extremely modest hardware configurations: 400MHz Pentium II's with 128 MB RAM. Most Ark monitors run versions of the FreeBSD open source operating system software, with a few running the Linux open source software. In addition to easily integrating new monitors, Ark's modest hardware and software configuration requirements and small application profile have allowed us to easily integrate re-purposed hardware infrastructure from past NSF funded projects [7,5], further leveraging those prior investments. The proposed data and computational servers will provide the necessary boost in our ability to store and process the increasing amounts of data we expect to collect from the additional deployments of new monitors and the increased scope of measurement activity on Ark, and will allow us to work at a level of efficiency that ensures availability and timely delivery of data to the research community.4.2 Software and data modules to support new types of research
Our infrastructure developments focus on enabling new and heretofore impossible macroscopic Internet measurement experiments.- In addition to creating an API for external researchers to use our bulk DNS service, we will also improve performance to handle increased data sizes.
- We will (finally) be able to develop a module to link topology data to global BGP (inter-domain routing) data, requested by many researchers over the years and again at our most recent workshop [18], where we had a breakout session to develop a strategy for tying Ark to BGPmon [47]. Integration with a source of BGP data such as BGPmon or RIPE RIS [48] will transform Ark into an instrument for studying not only topology, but also Internet routing dynamics, and their impact on observed topology structure.
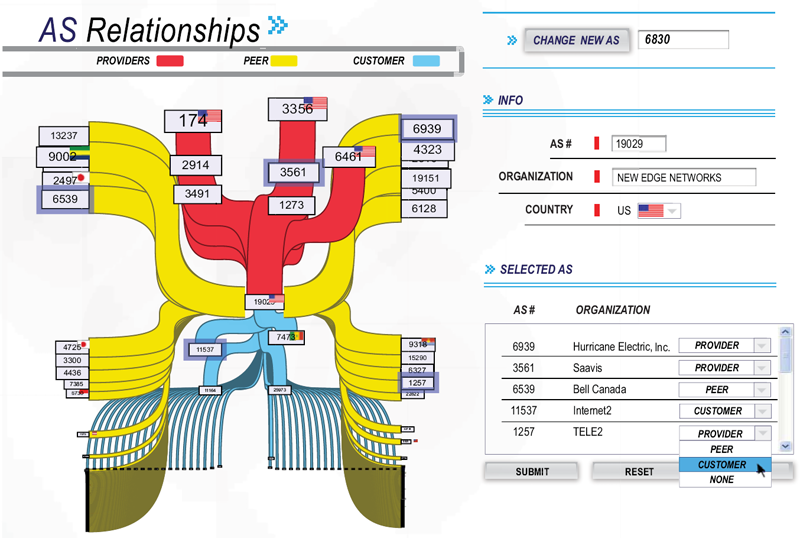
- We will implement new visualization software module to support improved presentation as well as validation against ground truth, recognized by the community as the most persistent and daunting methodological problem for topology researchers [49,18]. Inspired by simple but successful web-based interfaces for coaxing ground truth about network infrastructure out of its operators, we are designing a visualization tool that will not only reveal insights into inter-domain topology, but also provide performance information useful to both operators and researchers. Figure 3 shows a mockup of our new AS Relationship visualization and web-based validation interface to the data used to create it. We have found that the existence of a clean visualization creates an incentive (i.e., easy method) for operators to correct our data, since it provides them a understandable view of their network. The visualization will also benefit us and others with understanding the data.
- We will consolidate, refine, and generalize our tool set for active measurement workflows. The workflow covers the many activities surrounding the actual execution of a measurement. In order to conduct a measurement, researchers must compile their tools on multiple target operating system versions (Linux and several FreeBSD versions), distribute tools and input data to monitors, start and stop measurements, monitor progress, download data, and process data in preparation for analysis. Many of these tasks are common to a large class of measurements, and we have a collection of scripts to automate most of them, but work is needed to produce a more accessible complete system for Ark users.
- We will implement an additional measurement engine called mper based on scamper that will be useful for parallel low-level dynamic measurements. This engine will supplement scamper rather than replace it, supporting low-level probes that scamper does not support, that need precise control over probe spacing and timing, and that need to react more swiftly and dynamically to probing responses than scamper allows. Scamper will continue to serve as the operational measurement engine.
5 Research enabled by the infrastructure and data
Ark and the data sets it generates have already improved our ability to conceptualize, visualize, and formalize observations of the Internet's behavior, structure, and evolution, as well as support study of broader network science questions. Section 3 reviewed how Ark enabled our own measurement research and collaborations, but a broadly based research community has also benefited from our active topology measurements for over a decade. Our web site has a list of known publications by non-CAIDA authors that make use of CAIDA data [50]. To summarize the 18 papers listed (a lower bound since reporting is not enforced), the AS Relationships Data has supported research on: routing on overlay networks; routing policy violations; and network security. Researchers have requested and downloaded topology data to support research in the areas of: modeling IPv4 and IPv6 AS-level topology and BGP behavior; alias resolution and router-level topology discovery; improving anycast implementations; new metrics for describing scale-free networks; evaluating router responsiveness to probes; peer-to-peer system scalability; improving visualization of complex systems; geolocation; modeling of delay; improved traceback for network attacks; and improved packet marking/filtering. Gunes and Sarac [51] analyzed router responsiveness to measurement probes using data from our previous infrastructure (now integrated into Ark), specifically "ten sets of ICMP traceroute path traces from CAIDA's skitter web site, the only source we are aware of publicly providing periodic historical topology data." [51] Our Internet topology data supports not only the networking but also the physical science communities [52], many of whom use results of Internet topology measurements, although they acknowledge unresolved methodological issues with the data [53,54,55,56,57,58,59,60,61,62,63,64,65,66,67,68,69,70,35,71,72]. We also get requests for topology data from the simulation community, stock market analysts (who were interested in characterizing infrastructure stability), geolocation researchers, and others. Our infrastructure has also revealed important unresolved methodological issues for topology analysis detailed in Section 3, which we have designed our proposed enhancements to most efficiently study. Most early Internet topology analysis and modeling used BGP rather than traceroute data, for its ease of interpretation and use. Several researchers have independently shown that BGP-based topology measurements yield results [39,73,74] that differ from those based on traceroute-based measurements [7,1], due in part to unvalidated alias resolution techniques. Others, most recently Bush, et al. [75] have demonstrated that BGP observation points are also poor indicators of prefix reachability, since: (1) they tend to be closer to core locations of the Internet and thus underestimate propagation of prefixes and miss peripheral links; and (2) the surprisingly common use of default routing - not only at the edge but in transit providers - sheds doubt on the accuracy of solely BGP-based inferences. We agree that both control-plane and data-plane measurements are needed to study the most fundamental questions about the Internet's structure, dynamics, and evolution. By coupling Ark's data-plane capabilities to a BGP monitoring infrastructure, we enable more powerful aggregated data sets, including annotations about which paths are observably used, allowing validation across disparate data sources as well as against our ground truth data sets.5.1 New research enabled by this infrastructure
We provide examples of expanded boundaries of research enabled by our proposed enhancements to CAIDA's active measurement infrastructure. Resource limitations will prevent us from supporting all of these simultaneously; we will use the workshops to review and prioritize experiments as a community.- Improved topology discovery techniques, such as more efficient probing algorithms [76], or probing techniques that exploit information about clustering or subnets to limit measurement overhead [77,72].
- Validation of topology inferences, by allowing for regular updates of ground truth corresponding to inferred information, recognized for years as one of the research community's biggest problems. Recent regulations requiring peering related data for use of U.S. government funding [78] render it more likely than in the last two decades that some providers will be providing this data [79], but there is still no technology to support efficient provision and protected sharing of the data. We are developing visualization tools to address the efficiency goal (see figure 3) and our privacy-sensitive framework to address data protection [80].
- More accurate continuous topology coverage analysis. We (CAIDA) will be able to expand the range of data sources our AS Ranking system uses to infer AS business relationships. The system ranks ASes by their location in the hierarchy [81,82], specifically how many IP prefixes they or their customers advertise using information collected by the BGP archives. We currently limit ourselves to information collected by Routeviews [38] and RIPE NCC's [48] BGP archives, which miss many AS links present in the Internet. By including data collected by our Ark monitors, we will be able to increase our overall coverage and the accuracy of the resulting AS ranking inferences.
- Discovery of metric structure underlying Internet topology. One of the key differences between Internet maps extracted from BGP and traceroute measurements is the strength of clustering, i.e., the number of triangular subgraphs [70]. A recent CAIDA study [83] provided evidence that clustering appears to not only reflect some metric structure underlying the Internet (and other complex networks), but actually improve its navigability, i.e., the ability to efficiently find paths without knowledge of the complete global topology [84]. Accurately capturing clustering characteristics of the network will help discover its metric structure, which may allow radically improved Internet routing efficiency [85].
- Detection of traffic filtering. Various types of traffic filtering, including address-based and port-based, can only be diagnosed with a combination of active measurement and the involvement of a cooperating remote site. For example, filtering of unallocated address space (a.k.a. bogon filtering) is somewhat prevalent, but when filters are not kept up-to-date they cause connectivity problems for newly-allocated addresses [86,87]. Detection of port-blocking is another research area limited by the lack of a large-scale infrastructure to help identify and assess the extent of stale or questionable filtering. Ark can play a role by either receiving probes sent by participating end users (similar to the Spoofer experiment described in section 3.4), or by sending out specially-crafted probes to end hosts to test reachability and other properties.
- Longitudinal studies of router-level Internet. Last year Dhamdhere and Dovrolis published a study of the historical behavior of the AS-level Internet [88], using BGP data to provide a historical perspective on the AS-level Internet ecosystem. Completing such a study for the router-level ecosystem is a much grander challenge, but one with substantial payoffs for network science as well as national security. Statistical models for growth of the AS-level Internet will also benefit from historical data that links observed paths with BGP-based observations [89].
- Support for research into future Internet architectures. Without applied studies of real-world Internet behavior, researchers will be examining future Internet architectural research questions in a vacuum [90,91,92]. Ark provides an opportunity to test and refine hypotheses about how the current Internet operates. Our new modules for integration with other sources of data as well as external validation of measurements and inferences against reported reality will help to balance the inevitable trade-off between fidelity and utility of network models [92].
- Support for network science. Ark directly addresses a short-term call in the Network Science and Engineering Council's recently published research agenda [92], namely to improve the quality of measurement-driven research in the computer networking community. Our proposed scope of work also addresses the report's long-term call: using the results of Internet research to improve the quality of measurement-based research in other domains of network science. Sustainable funding for large-scale measurement instrumentation past the span of a given funded research project has eluded the Internet research community, which has inhibited progress in development of an empirically grounded network science agenda. This CRI will directly address this gap, contributing a measurement platform as well as vital data resources to the creation of an underlying discipline that formalizes our observations and understanding of large-scale, complex networked systems [92].
6 Community development: workshops
In response to overwhelming positive feedback about our Active Internet Measurement Workshop (AIMS) in February 2009 [18], we will coordinate a series of annual workshops to discuss operational problems, research results, and future plans. We will also use these workshops to discuss and document community strategies and standards for collection, archiving, and use of data, including data sets that are incomplete and/or overwhelmingly large [92]. Building on our previous workshops on Internet topology measurement [15,49,18], we will pursue open discussion on best practices and guidelines to promote a diverse respected field of Internet active measurement research. In response to an explicit recommendation at the AIMS workshop, we will also help facilitate interaction between Internet researchers and Institutional Review Boards (IRB) that overview and regulate human research activities at individual institutions [18], by for example posting copies of our own IRB applications [93]. In the first year of this project, CAIDA will host a workshop focused on measurement needs for validation of modeling and simulation, bringing together researchers, preferentially graduate students, with measurement experts and operators at Ark hosting sites who can provide insights into collected measurements. We will organize the two-day workshop with topics primarily relevant to Ark hosting sites on day one and topics relevant to researchers on the other. In year two we will hold a workshop to introduce and gather feedback on the first version of the data correlation tools we develop for this project, including discussing which formatting and post-processed forms of the data are most useful to the researchers. We will also explore structured data-sharing frameworks such as perfsonar [94] and RIPE's INRDB [95] as possible intermediate layers between measurement data and the applications that need it. In year three our workshop will discuss technology transfer possibilities such as spin-off capabilities of Ark-based technology. One option is development of a stand-alone Ark measurement tool kit that allows sites that do not host an Ark monitor to run topology measurements and generate HTML-based reporting of statistics characterizing a network's reachability and performance, e.g., path length, RTT ranges, AS and IP dispersion graphs [96] Each year's workshop will include discussion of how to assess the needs of the researchers and how we can enhance our infrastructure to support these needs. These workshops will provide an opportunity to present research using the data collected from the infrastructure, get feedback on operational idiosyncrasies of the data, and discuss new or changing measurement needs to support validation tasks for the following year.7 Quality of service metrics and evaluation
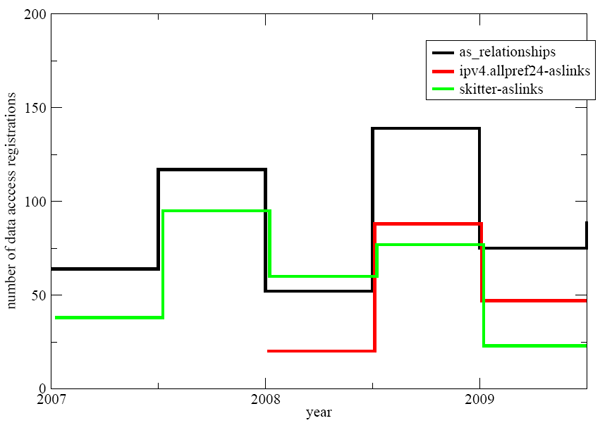
The Number of data access registrations for each six month period. Most registrations occur at the beginning of the school year, with a stark increase in the number of registrations between the last half of '07 and '08 for both AS relationships and Ark's IPv4 AllPref24 ASlinks. The decline of skitter's aslinks reflects the fact that skitter was discontinued and researchers are typically interested in recent data.
| Pct. | Total | Resp. Time |
| 36% | 439 | within 1 day |
| 61% | 625 | within 2 days |
| 89% | 1090 | within 1 week |
| 98% | 1192 | within 1 month |
8 Why CAIDA is the most appropriate team for this project
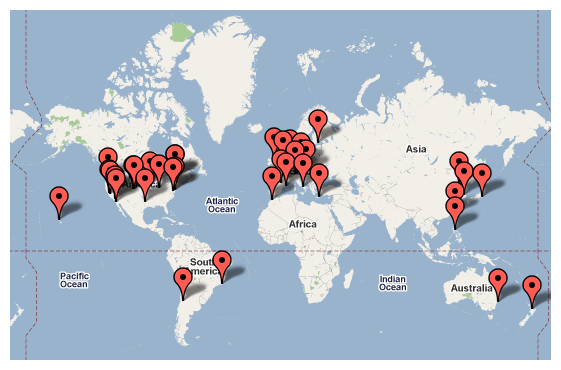
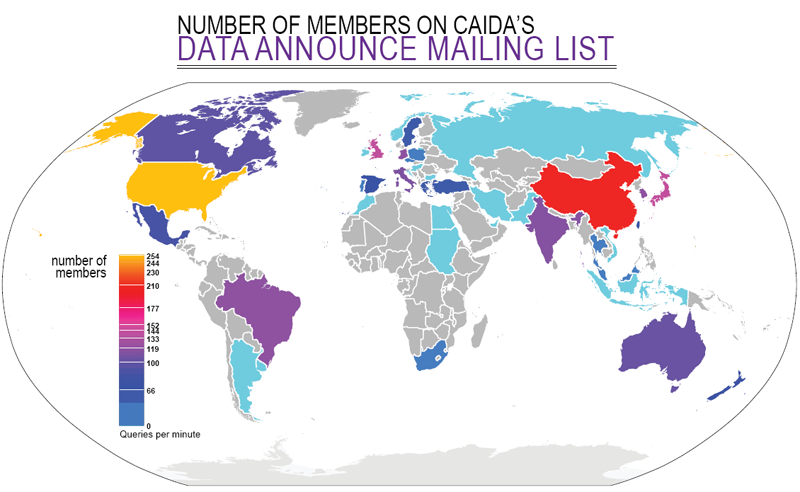
CAIDA represents a unique combination of relevant experience, talents and facilities necessary to achieve the proposed goals. CAIDA is recognized as a world leader in Internet measurement and data analysis, and has provided several landmark studies of Internet performance, workload, and topology issues [97]. CAIDA personnel has years of experience in development, implementation, and evaluation of measurement infrastructure, as well as with anonymization and analysis tools for the gathered data. CAIDA's long-standing trust relationships with many Internet service providers and equipment vendors facilitate monitor deployment, verification of measurement results with ground truth data, and informed analyses. To technical, operational, and policy communities, CAIDA is among the most trusted sources of measurement tools and analyses. CAIDA is an active participant in the PREDICT project, which aims to provide protected datasets to cybersecurity researchers. We also pursue the reuse of social infrastructure which aids considerably our efforts to maintain hardware in the field. A portion of our labor goes toward maintenance of the existing servers and remote monitors. We leverage donations of power, cooling, and rack space but most importantly much of our progress comes via contributions from volunteers offering remote hands. These contacts usually happen organically and emerge from interest in experiments that demand global collaboration and stem from a desire to become part of a scientific community working to better understand the Internet through measurement. Housed at the San Diego Supercomputer Center, the University of California San Diego, this project will contribute to the development of the innovation economy and future economic security through the involvement of five professional researchers developing educational materials with the data from this project. Moreover, the long term impact will be the generation of new knowledge and possible development of new ideas, technologies, and devices adding a potential to generate new companies and more jobs. Note that UCSD has a proven track record with faculty who have started 193 new companies which have generated nearly 130,000 jobs. This proposal also meets the challenge set out by the President and Congress to stimulate the economy through job creation. An immediate impact within CAIDA is keeping seven persons employed. Additionally, a wider impact for the San Diego region can be estimated using methodology from a recent evaluation of UCSD role in the local and global economy developed by CBRE Consulting, Inc. [98]. The CBRE report shows that for every $1.00 the campus spends, an additional $0.92 in spending occurs in San Diego County. They also estimate that every $170,000 of UCSD spending generate one new job (not counting UCSD employment) in San Diego County. Therefore, approximately 12-13 jobs will be added locally as the result of this project. CAIDA has a strong record of integrating diversity into our activities. Since 1999, the composition of our 90 paid interns has included 25 females, 21 Asians and 4 Hispanics. Our 25 volunteer interns in that same period have included one female, and 5 Asian students. Geographic diversity of our data user community is even wider, as shown in Figure 5.9 Management Plan
Throughout the project we will emphasize support for external researchers wishing to run experiments on Ark. We will provide data storage, analysis tools, Internet measurement expertise and advice, and a system for continuous feedback to improve the operation of our experimental infrastructure and to increase user satisfaction. The labor effort includes: 1) maintenance and support of the central server and remote monitors, 2) integration and deployment of new monitors and coordination with remote sites, 3) integration of data and compute servers, and network switch, 4) software development including bulk DNS queries, interactive visualization, and integration of real time routing data, 5) curation, archival and distribution of the data, 6) development of supporting documentation, web pages, surveys, and educational materials, and 7) organization of annual workshops and publication of resulting reports. CAIDA personnel will be responsible for accomplishing all proposed tasks. The detailed project timeline follows. Note that the submitted budget will support a full-time effort for only one system administrator, and only part-time effort for the other five researchers involved, so we spread some of the proposed tasks, particularly software development, over longer intervals than they would otherwise require.9.1 Year 1.
-
Hardware additions
- Integrate 10 new Ark monitors into Ark platform - full year.
- Acquire fast network switch, upgrade and re-configure CAIDA network - 1st quarter.
- Acquire a new data server and put it into production mode - 3rd quarter.
-
Software development
- Implement mper measurement engine - 1st, 2nd, and 3rd quarters.
- Design interactive visualization to support validation with network operators - full year.
- Conduct a pilot study on integrating Ark topology measurements and real-time routing data - full year.
-
Communal activities
- Develop project web pages and post updates on data collection status, list ongoing Ark experiments, and other project-related information - 1st quarter.
- Develop a web-based survey to assess the level of user satisfaction and to provide a communication channel between users and CAIDA personnel - 2nd quarter (to have results available for discussion at the workshop).
- Organize a workshop on measurement needs for validation of modeling and simulation - 3rd quarter.
9.2 Year 2.
-
Hardware additions
- Integrate 10 new Ark monitors into Ark platform - full year.
- Acquire a new compute box for AS relationship and AS ranking calculation, put it into production mode - 1st quarter.
-
Software development
- Upgrade the code for AS relationship and AS ranking calculations to fully utilize advanced computational capabilities of a new machine - 1st, 2nd, and 3rd quarters.
- Develop external API to our bulk DNS lookup service - 1st and 2nd quarters.
- Refine mper measurement engine based on experience - 4th quarter.
- Using the interactive visualization and related web forms, collect feedback from network operators regarding the completeness and veracity of data about their networks - full year.
- Integrate Ark topology measurements and real-time Internet routing data - full year.
-
Communal activities
- Publish the workshop report - 1st quarter.
- Publish our IRB application for active measurement experiments.
- Organize a workshop to introduce and gather feedback on the first version of the data correlation tools, including on which formatting and post-processed forms of the data are most useful to researchers - 4th quarter.
9.3 Year 3.
-
Hardware additions
- Integrate 10 new Ark monitors into Ark platform - full year.
-
Software development
- Improve topology mapping techniques based on the feedback received from network operators - full year.
- Study new visualization techniques for IPv6 topology data - 1st quarter.
- Serve integrated topology and routing data to the research community - 2nd quarter.
- Develop code to automatically annotate topology data with hostnames - 4th quarter.
- Consolidate, refine, and generalize tool set for active measurement workflows - 2nd and 3rd quarters.
-
Communal activities
- Publish the workshop report - 1st quarter.
- Based on our experience with external researchers using Ark infrastructure, prepare guidelines for Internet measurement data sharing - 2nd quarter.
- Organize a workshop to discuss technology transfer possibilities of Ark-based technology, e.g., stand-alone Ark measurement tool kit - 4th quarter.
- Widely circulate and publish project results - 3rd and 4th quarters (before workshop).
- Prepare plans how to maintain funding for the developed large-scale network measurement infrastructure after the end of this project - full year.
10 Senior Personnel and Collaborators
The proposed infrastructure supports a broad community of academic researchers who do or plan to make direct use of the infrastructure to execute their own experiments, make use of the data sets that result from CAIDA's existing experiments and diverse end users including network security and law enforcement and network operators who make use of the data for operational and forensic purposes. People listed as collaborators below plan to make direct use of the infrastructure to run experiments or to integrate complementary data sets. Many of these collaborators attended our recent Active Internet Measurements (AIMS09) workshop [18] and helped craft the workshop final report which describes emerging community consensus on management policy for community measurement platforms and how to increase transparency, improve best practices, promote a diverse and heterogeneous field of Internet active measurement and how collaborative solutions would maximize the benefit of research at minimal cost.- Kimberly Claffy; UC, San Diego; PI
- Bradley Huffaker, UC, San Diego, Senior Personnel
- Young Hyun, UC, San Diego, Senior Personnel
- Emile Aben, RIPE-NCC, Collaborator
- Rob Beverly, MIT and Naval Postgraduate School, Collaborator
- Xenofontas Dimitropoulos, Swiss Federal Institute of Technology, Collaborator
- Constantine Dovrolis, Georgia Institute of Technology, Collaborator
- Minaxi Gupta, Indiana University, Collaborator
- Alistair King, University of Waikato, NZ, Collaborator
- Matthew J. Luckie, University of Waikato, NZ, Collaborator
- Dan Massey, Colorado State University, Collaborator
References
- [1]
- Y. Hyun and CAIDA, "Archipelago Measurement Infrastructure," 2009. https://www.caida.org/projects/ark/.
- [2]
- R. Beverly and S. Bauer, "The spoofer project: inferring the extent of source address filtering on the internet," in SRUTI'05: Proceedings of the Steps to Reducing Unwanted Traffic on the Internet on Steps to Reducing Unwanted Traffic on the Internet Workshop, (Berkeley, CA, USA), pp. 8-8, USENIX Association, 2005.
- [3]
- CAIDA, "Macroscopic Topology Measurements." Research Project. https://www.caida.org/projects/macroscopic/.
- [4]
- S. Kalidindi and M. J. Zekauskas, "Surveyor: An infrastructure for Internet performance measurements," in INET'99, June 1999.
- [5]
- "Active Measurement Project." http://amp.nlanr.net/.
- [6]
- V. Paxson, A. Adams, and M. Mathis, "Experiences with NIMI," in Passive and Active Measurement, Apr. 2000.
- [7]
- CAIDA, "skitter active measurement tool."https://www.caida.org/catalog/software/skitter/.
- [8]
- D. G. Andersen, H. Balakrishnan, M. F. Kaashoek, and R. Morris, "Resilient overlay networks," in SOSP, pp. 131-145, 2001.
- [9]
- Y. Sekiya, K. Cho, and Y. Kuga, "Gulliver active measurement system," 2009. http://gulliver.wide.ad.jp/.
- [10]
- L. Peterson, T. Anderson, D. Culler, and T. Roscoe, "A blueprint for introducing disruptive technology into the Internet," in Hotnets, pp. 59-64, 2002.
- [11]
- H. Madhyastha, T. Isdal, M. Piatek, C. Dixon, T. Anderson, A. Krishnamurthy, and A. Venkataramani, "iplane: an information plane for distributed services," in OSDI '06: Proceedings of the 7th USENIX Symposium on Operating Systems Design and Implementation, (Berkeley, CA, USA), pp. 26-26, USENIX Association, 2006.
- [12]
- Harsha V. Madhyastha and Ethan Katz-Bassett and Thomas Anderson and Arvind Krishnamurthy and Arun Venkataramani, "iplane nano: path prediction for peer-to-peer applications," in Network Systems Design and Implementation, Apr. 2009.
- [13]
- E. Katz-Bassett, H. V. Madhyastha, J. P. John, A. Krishnamurthy, and T. Anderson, "Studying black holes in the Internet with Hubble," in Networked Systems Design and Implementation, 2008. https://www.usenix.org/legacy/events/nsdi08/tech/full_papers/katz-bassett/katz-bassett.pdf.
- [14]
- N. Spring, L. Peterson, A. Bavier, and V. Pai, "Using PlanetLab for network research: myths, realities, and best practices," in Proceedings of the Second USENIX Workshop on Real, Large Distributed Systems (WoRLDS), (San Francisco, CA), Dec. 2006.
- [15]
- k claffy, M. Crovella, T. Friedman, C. Shannon, and N. Spring, "Community-Oriented Network Measurement Infrastructure (CONMI) Workshop Report," in CONMI Workshop, Mar. 2005. https://catalog.caida.org/paper/2005_conmi/.
- [16]
- Y. Shavitt and E. Shir, "DIMES: Let the Internet Measure Itself," tech. rep., Tel-Aviv University EE Department, 2005.
- [17]
- D. R. Choffnes and F. E. Bustamante, "Taming the torrent: a practical approach to reducing cross-isp traffic in peer-to-peer systems," SIGCOMM Comput. Commun. Rev., vol. 38, no. 4, pp. 363-374, 2008.
- [18]
- Marina Fomenkov and kc claffy and Rob Beverly and Ethan Katz-Bassett and Beverly A. Cox and Peter Haga and Matthew Luckie, "AIMS09: Final Workshop Report," 2009. https://catalog.caida.org/paper/2009_aims_report/aims_report.
- [19]
- "Ruby language." http://www.ruby-lang.org/.
- [20]
- M. Luckie, "scamper." https://www.caida.org/catalog/software/scamper/.
- [21]
- B. Augustin, T. Friedman, and R. Teixeira, "Multipath tracing with Paris traceroute," in Workshop on End-to-End Monitoring Techniques and Services (E2EMON), (Munich, Germany), pp. 1-8, May 2007.
- [22]
- N. Spring, D. Wetherall, and T. Anderson, "Scriptroute: A public Internet measurement facility," in 4th USITS, Mar 2003.
- [23]
- "The Metasploit Project." http://www.metasploit.com/.
- [24]
- "Scapy." http://www.secdev.org/projects/scapy/.
- [25]
- E. Katz-Bassett, H. V. Madhyastha, J. P. John, and A. Krishnamurthy, "Studying black holes in the Internet with Hubble," in Networked Systems Design and Implementation (NSDI), Apr 2008.
- [26]
- D. Gelernter and N. Carriero, "Coordination languages and their significance," Commun. ACM, vol. 35, no. 2, pp. 97-107, 1992.
- [27]
- S. Ossowski and R. Menezes, "On coordination and its significance to distributed and multi-agent systems," Concurrency and Computation: Practice and Experience, vol. 18, no. 4, pp. 359-370, 2006.
- [28]
- D. Gelernter, "Generative communication in linda," ACM Trans. Program. Lang. Syst., vol. 7, no. 1, pp. 80-112, 1985.
- [29]
- N. Carriero and D. Gelernter, How to write parallel programs: a first course. Cambridge, MA, USA: MIT Press, 1990.
- [30]
- "CAIDA IPv4 routed /24 topology dataset." https://www.caida.org/catalog/datasets/ipv4_routed_24_topology_dataset/.
- [31]
- B. Augustin, X. Cuvellier, B. Orgogozo, F. Viger, T. Friedman, M. Latapy, C. Magnien, and R. Teixeira, "Avoiding traceroute anomalies with Paris traceroute," in IMC '06: Proceedings of the 6th ACM SIGCOMM conference on Internet measurement, (Rio de Janeiro, Brazil), pp. 153-158, Oct. 2006.
- [32]
- B. Augustin, T. Friedman, and R. Teixeira, "Measuring load-balanced paths in the Internet," in Proceedings of the 7th ACM SIGCOMM conference on Internet measurement, (San Diego, California, USA), pp. 149-160, Oct. 2007.
- [33]
- M. Luckie, Y. Hyun, and B. Huffaker, "Traceroute Probe Method and Forward IP Path Inference," in IMC'08, Oct 2008.
- [34]
- M. Gunes and K. Sarac, "Resolving IP aliases in building traceroute-based Internet maps," Technical Report UTDCS-62-06, University of Texas at Dallas, 2006.
- [35]
- A. Bender, R. Sherwood, and N. Spring, "Fixing ally's growing pains with velocity modeling," in Internet Measurement Conference, 2003. http://www.cs.umd.edu/ bender/radargun/.
- [36]
- Ken Keys, "Alias Resolution: Technical Report," 2009. https://catalog.caida.org/paper/2008_alias_resolution_techreport.
- [37]
- K. Keys, Y. Hyun, and M. Luckie, "Maars: Multi-approach alias resolution system." In preparation, 2009.
- [38]
- David Meyer, "University of oregon route views project." http://www.routeviews.org/.
- [39]
- Ricardo Oliveira and Dan Pei and Walter Willinger and Beichuan Zhang and Lixia Zhang, "Quantifying the Completeness of the Observed Internet AS-level Structure," 2008.
- [40]
- Z. M. Mao, J. Rexford, J. Wang, and R. Katz, "Towards an accurate AS-level traceroute tool," in Proc. ACM SIGCOMM, (Karlsruhe, Germany), pp. 365-378, Sept. 2003.
- [41]
- C. Magnien, F. Ouédraogo, G. Valadon, and M. Latapy, "Fast Dynamics in Internet Topology: Observations and Explanations," tech. rep., IEEE, 2009. http://ieeexplore.ieee.org/search/wrapper.jsp?arnumber=5076362.
- [42]
- Ying-Ju Chi and Ricardo Oliveira and Lixia Zhang, "Cyclops: The AS-level Connectivity Observatory," ACM Computer Communications Review, Oct. 2008.
- [43]
- X. Dimitropoulos, D. Krioukov, G. Riley, and kc claffy, "Revealing the Autonomous System taxonomy: The machine learning approach," in PAM, 2006.
- [44]
- "Autonomous System taxonomy repository." http://www.ece.gatech.edu/research/labs/MANIACS/as_taxonomy/.
- [45]
- X. Dimitropoulos, D. Krioukov, M. Fomenkov, B. Huffaker, Y. Hyun, kc claf fy, and G. Riley, "AS relationships: Inference and validation," Comput Commun Rev, vol. 37, no. 1, 2007.
- [46]
- B. Donnet, P. Raoult, T. Friedman, and M. Crovella, "Efficient algorithms for large-scale topology discovery," in Sigmetrics 2005, 2005. http://rp.lip6.fr/site_npa/site_rp/_publications/595-49-Donnet.pdf.
- [47]
- Dan Massey, et al., "BGP monitoring system: next generation software dedicated to BGP montioring," July 2009. http://bgpmon.netsec.colostate.edu.
- [48]
- RIPE NCC, "RIPE's Routing Information Service," 2009. http://www.ris.ripe.net/.
- [49]
- D. Krioukov, k. claffy, M. Fomenkov, F. Chung, A. Vespignani, and W. Willinger, "The workshop on internet topology (wit) report," SIGCOMM Comput. Commun. Rev., vol. 37, no. 1, pp. 69-73, 2007.
- [50]
- "Papers Published Using CAIDA Datasets." https://www.caida.org/data/publications/.
- [51]
- M. H. Gunes and K. Saraç, "Analyzing router responsiveness to active measurement probes.," in PAM (S. B. Moon, R. Teixeira, and S. Uhlig, eds.), vol. 5448 of Lecture Notes in Computer Science, pp. 23-32, 2009.
- [52]
- R. Albert and A.-L. Barabási, "Statistical mechanics of complex networks," Reviews of Modern Physics, vol. 74, pp. 47-97, 2002.
- [53]
- G. Siganos, M. Faloutsos, P. Faloutsos, and C. Faloutsos, "Power-laws and the AS-level Internet topology," ACM/IEEE Transactions on Networking, vol. 11, no. 4, pp. 514-524, 2003.
- [54]
- T.Bu and D. Towsley, "On distinguishing between Internet power law topology generators," in IEEE INFOCOM, 2002.
- [55]
- H. Tangmunarunkit, R. Govindan, S. Jamin, S. Shenker, and W. Willinger, "Network topology generators: Degree-based vs. structural," in ACM SIGCOMM, pp. 147-159, 2002.
- [56]
- Q. Chen, H. Chang, R. Govindan, S. Jamin, S. J. Shenker, and W. Willinger, "The origin of power laws in Internet topologies revisited," in IEEE INFOCOM, 2002.
- [57]
- W. Willinger, R. Govindan, S. Jamin, V. Paxson, and S. Shenker, "Scaling phenomena in the Internet: Critically examining criticality," PNAS, vol. 99, no. Suppl. 1, pp. 2573-2580, 2002.
- [58]
- H. Chang, S. Jamin, and W. Willinger, "Internet connectivity at the AS level: An optimization driven modeling approach," in Proceedings of MoMeTools, 2003.
- [59]
- S. Zhou and R. J. Mondragon, "Towards modelling the Internet topology - the Interactive Growth Model," in Proceedings of the 18th International Teletraffic Congress (ITC18), (Berlin), 2003. http://arxiv.org/abs/cs.NI/0303029.
- [60]
- A. Vázquez, R. Pastor-Satorras, and A. Vespignani, "Large-scale topological and dynamical properties of the Internet," Physical Review E, vol. 65, no. 06, p. 066130, 2002. http://arxiv.org/abs/cond-mat/0112400.
- [61]
- A. Capocci, G. Caldarelli, R. Marchetti, and L. Pietronero, "Growing dynamics of Internet providers," Physical Review E, vol. 64, p. 35105, 2001.
- [62]
- S. N. Dorogovtsev, A. V. Goltsev, and J. F. F. Mendes, "Pseudofractal scale-free web," Physical Review E, vol. 65, no. 06, p. 066122, 2002.
- [63]
- S.-H. Yook, H. Jeong, and A.-L. Barabási, "Modeling the Internet's large-scale topology," PNAS, vol. 99, pp. 13382-13386, 2002.
- [64]
- K.-I. Goh, B. Kahng, and D. Kim, "Fluctuation-driven dynamics of the Internet topology," Physical Review Letters, vol. 88, p. 108701, 2002.
- [65]
- G. Caldarelli, A. Capocci, P. D. L. Rios, , and M. A. M. noz, "Scale-free networks from varying vertex intrinsic fitness," Physical Review Letters, vol. 89, p. 258702, 2002.
- [66]
- G. Caldarelli, P. D. L. Rios, and L. Pietronero, "Generalized Network Growth: from microscopic strategies to the real Internet properties." http://arxiv.org/abs/cond-mat/0307610.
- [67]
- S. N. Dorogovtsev and J. F. F. Mendes, Evolution of Networks: From Biological Nets to the Internet and WWW. Oxford: Oxford University Press, 2003.
- [68]
- R. Pastor-Satorras and A. Vespignani, Evolution and Structure of the Internet. Cambridge University Press, 2004.
- [69]
- P. Mahadevan, D. Krioukov, M. Fomenkov, B. Huffaker, X. Dimitropoulos, kc claffy, and A. Vahdat, "Lessons from Three Views of the Internet Topology," tech. rep., CAIDA at UC, San Diego, 2005. https://catalog.caida.org/paper/2005_tr_2005_02.
- [70]
- P. Mahadevan, D. Krioukov, M. Fomenkov, B. Huffaker, X. Dimitropoulos, kc claffy, and A. Vahdat, "The Internet AS-level topology: Three data sources and one definitive metric," Comput Commun Rev, vol. 36, no. 1, pp. 17-26, 2006.
- [71]
- P. Fraigniaud, E. Lebhar, and L. Viennot, "The Inframetric Model for the Internet," 2008. http://www.liafa.jussieu.fr/~elebhar/inframetric.pdf.
- [72]
- Z. Pei-Dong, S. Huai-Zhou, and L. Xin, "An enhanced router topology discovery model," in CNSR '09: Proceedings of the 2009 Seventh Annual Communication Networks and Services Research Conference, (Washington, DC, USA), pp. 431-433, IEEE Computer Society, 2009.
- [73]
- Ricardo Oliveira, "UCLA's IRL Internet Topology Collection," July 2009. http://irl.cs.ucla.edu/topology/.
- [74]
- Ying Zhang and Zheng Zhang and Z. Morley Mao and Y. Charlie Hu and Bruce M. Maggs, "On the Impact of Route Monitor Selection," in SIGCOMM Internet Measurement Conference 2007, 2007.
- [75]
- Randy Bush and Olaf Maennel and Matt Roughan and Steve Uhlig, "Use of Default in the 'DFZ'," June 2009. http://archive.psg.com/090615.nanog-default.pdf.
- [76]
- Alistair King, "Efficient topology discovery of load balanced paths," apr 2009. 2nd CAIDA/WIDE/CASFI Workshop, https://www.caida.org/workshops/wide-casfi/0904/slides/aKingWide09.pdf.
- [77]
- D. Saucez, B. Donnet, and O. Bonaventure, "On the impact of clustering on measurement reduction," in Proc. IFIP Networking, May 2009.
- [78]
- N. Telecommunications and I. Administration, "Broadband initiatives program," Broadband Technology Opportunities Program; Notice, 2009. http://www.ntia.doc.gov/frnotices/2009/FR_BBNOFA_090709.pdf.
- [79]
- kc claffy, "Ten things lawyers should know about the internet." https://catalog.caida.org/paper/2008_lawyers_top_ten.
- [80]
- E. Kenneally and K. Claffy, "An Internet Data Sharing Framework For Balancing Privacy and Utility," July 2009. https://catalog.caida.org/paper/2009_engaging_data.
- [81]
- CAIDA, "Ranking of internet service providers by observed topology," 2005.
- [82]
- X. Dimitropoulos, D. Krioukov, B. Huffaker, kc claffy, and G. Riley, "Inferring as relationships: Dead end or lively beginning?," in 4th Workshop on Efficient and Experimental Algorithms, 2005.
- [83]
- M. Á. Serrano, D. Krioukov, and M. Boguñá, "Self-similarity of complex networks and hidden metric spaces," Phys Rev Lett, vol. 100, p. 078701, 2008.
- [84]
- M. Boguñá, D. Krioukov, and kc claffy, "Navigability of complex networks," Nature Physics, vol. 5, pp. 74-80, 2009.
- [85]
- D. Krioukov, F. Papadopoulos, A. Vahdat, and M. Boguna, "On Curvature and Temperature of Complex Networks," Mar. 2009. http://arxiv.org/abs/0903.2584.
- [86]
- R. Bush, J. Hiebert, O. Maennel, M. Roughan, and S. Uhlig, "Testing the reachability of (new) address space," in Sigcomm workshop on Internet network management, Aug. 2007.
- [87]
- RIPE NCC, "De-Bogonising New Address Blocks," July 2009. http://www.ris.ripe.net/debogon/.
- [88]
- Amogh Dhamdhere and Constantine Dovrolis, "Ten Years in the Evolution of the Internet Ecosystem," in SIGCOMM Internet Measurement Conference 2009, 2008. http://www.cc.gatech.edu/fac/Constantinos.Dovrolis/Papers/internet-evolution-imc08.pdf.
- [89]
- R. G. Clegg, R. Landa, U. Harder, and M. Rio, "Evaluating and optimising models of network growth," CoRR, vol. abs/0904.0785, 2009.
- [90]
- N. workshop report, "Overcoming barriers to disruptive innovation in networking," January 2005.
- [91]
- M. Baard, "Net Pioneer Wants New Internet," WIRED, June 2005.
- [92]
- Ellen Zegura, "Network Science and Engineering (NetSE) Research Agenda," July 2009. http://archive2.cra.org/ccc/files/docs/NetSE-Research-Agenda.pdf.
- [93]
- CAIDA, "Caida's application to the ucsd irb," 2008. https://www.caida.org/about/irb/caida_irb_app_cover_17oct2008.
- [94]
- B. Tierney, J. Boote, E. Boyd, A. Brown, M. Grigoriev, J. Metzger, M. Swany, M. Zekauskas, Y.-T. Li, , and J. Zurawski, "Instantiating a Global Network Measurement Framework," Tech. Rep. LBNL-1452E, LBNL, Jan. 2009. https://www.es.net/assets/Papers-and-Publications/perfsonar-roads.pdf.
- [95]
- RIPE NCC, "Internet Resource Number DataBase," July 2009. http://sgk.ripe.net:8000/.
- [96]
- CAIDA, "Archipelago monitor statistics." https://www.caida.org/projects/ark/statistics/.
- [97]
- CAIDA. https://catalog.caida.org/paper/.
- [98]
- CBRE Consulting, Inc., "A Study of the Economic Impact and Benefits of UC San Diego," 2008. http://ucsdnews.ucsd.edu/EconomicImpact/pdf/UC-San-Diego-Economic-Impact-Report-July-10-2008.pdf.
Footnotes:
1We encourage the reader to try out Spoofer (http://spoofer.csail.mit.edu).File translated from TEX by T T H, version 3.72.
On 17 Mar 2010, 16:53.