

Modeling IPv6 Adoption: A Measurement-driven Computational Approach - Proposal
The proposal for "Modeling IPv6 Adoption: A Measurement-driven Computational Approach" is also available in PDF.
Sponsored by:
")
Principal Investigators: kc claffy Amogh Dhamdhere kc claffy
Funding source: CNS-1528148 Period of performance: October 1, 2015 - September 30, 2018.
1 Motivation
Broad industry awareness of IPv4 address scarcity has driven widespread support for IPv6 in most modern operating systems and network equipment, but even with years of encouragement from regional address registries (RIRs), and government mandates [90,68], the actual uptake of IPv6 on the global Internet has been disappointing. Native IPv6 accounts for less than 1% of Internet traffic [19,69,28] and fewer than 6% of clients accessing Google [40]. Contributing to these bleak statistics is a vast ecosystem of software applications and devices, many of which still do not support IPv6. While transition technologies exist that allow IPv4 and IPv6 hosts to communicate [94,66,65], they also add complexity, and decrease performance and reliability. Further complicating the situation, the RIRs now permit IPv4 address holders to sell address allocations, and hundreds of address block transfers have already occurred [74,52,71,59]. Some companies, including many incumbent network infrastructure providers, are adopting a different solution to deal with the scarcity of globally unique addresses: Carrier Grade NATs (CGNs) - middleboxes that allow ISPs to serve many customers behind a few public IP addresses. While there is evidence that CGNs can hinder performance and break some applications [45], there are no large-scale empirical studies of their effects or implications for the ultimate deployment of IPv6.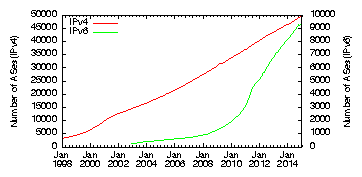
2 Background and related Work
Several measurement projects provide valuable data on of IPv6 adoption - end-user IPv6 capability [9,40], topology and end-user performance [32,21,76], and dynamics of IPv4 allocation and usage [47]. We will rely heavily on existing measurement efforts, and target new measurements to fill gaps in existing data, specifically related to address transfers and Carrier Grade NAT (CGN) prevalence and performance. IPv4 Transfer Markets: Recognizing the continued need for IPv4 addresses after the IANA and RIR supplies have exhausted, the RIR communities now allow intra-registry transfers of IPv4 addresses via a market mechanism, starting with RIPE NCC in December 2008 [83] and followed by ARIN [5] in mid-2009 and APNIC [8] in early 2010. Documented transfer transactions are steadily increasing in the RIPE and APNIC regions, although inter-registry transfers are currently only authorized between ARIN and APNIC [11] (Figure 3). Transfer markets can extend the usable life of IPv4, but they do not solve the fundamental address shortage problem, and carry significant known risks [14,15,33,57,58,27,79]. Markets will likely cause further fragmentation of the address space and larger IPv4 routing tables, or generate destabilizing speculation, hoarding, and leasing behavior1, on which RIR policies are unclear [77]. Mueller et al. [71] used published data on IPv4 transfers from 2009 to mid-2012 to find an increasing market for IPv4 addresses, with 89% of transferred addresses coming from legacy allocations (consistent with our own findings [59] described in Section 3.1). However, the same authors also found that the time lag between transfer and announcement is sometimes large [56], suggesting that the RIR's needs-based policies regarding transfers may not be enforcing prompt usage. But address space holders, especially holders of legacy space who are not under any contractual relationship with an RIR, may not have to adhere to RIR transfer policies; IPv4 address blocks may already be changing hands without RIR knowledge. Inferring address transfer activity from the best available data (Section 3.1) will inform ongoing debate on relative benefits and harms of address markets, and empirically ground our model of IPv6 adoption (Section 4).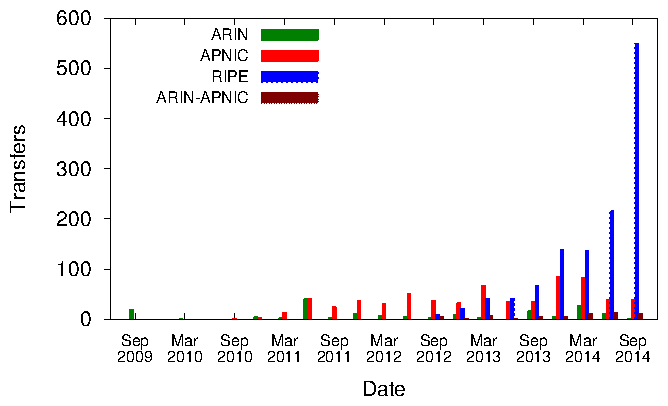
3 Task 1: Measure and characterize factors affecting IPv6 deployment
3.1 Characterizing IPv4 address transfer markets
A thriving market for IPv4 addresses is emerging [59,71], with an unknown fraction of approved transfers reported by the RIRs (Figure 3), and others happening "in the wild." Analyzing the public (reported) transfer market is straightforward, but we will explore three methods to infer unreported transfers and leases.3.1.1 Inferring unreported transfers and leases ("in the wild")
We will use three sources of data to experiment with inferring unreported transfers: BGP, DNS, and data-plane topology data. 1. Changes in BGP origin: A simple way to look for possible address transfers is to examine changes in the AS originating a prefix into the global BGP routing table. However, such changes could reflect other activities: infrastructure changes internal to an organization, traffic engineering, or transient prefix hijacks. Also, transfers from or to address space holders who let their provider handle the BGP announcement (Provider Aggregatable or PA space) could mislead this technique. We will improve our ability to filter out false positives without inducing false negatives, using the set of published transfers as validation data. We will use historical WHOIS data (which CAIDA archives from each RIR) along with BGP data to identify non-BGP speaking organizations, and filter out apparent transfers due to normal PA address space behavior. 2. Changes in authoritative DNS information: Two fields of DNS information could suggest a transfer has occurred. First, reverse DNS mappings are unlikely to change when an apparent transfer in BGP is due to reasons other than a transfer (e.g., a non-BGP speaker switching providers), but they should change for legitimate transfers. We will compare reverse DNS mappings before and after an apparent transfer to confirm or refute it, although this information may not be conclusive. Second, changes in the SOA record - which names the entity responsible for the reverse DNS zone of the queried prefix - may indicate a transfer of the associated IP addresses. CAIDA's and ISC's historical DNS data [22,48] are limited in scope and frequency, so we recently (October 2014) began more regular reverse DNS scanning of the routed IPv4 address space [23] to support finer-grained inference of transfers. 3. Data-plane signatures: We will develop methods that exploit data-plane information to 1) filter out false positives from the list of apparent transfers, and 2) detect transfers. In the first method we will classify (manually and using RIR lists) true and false positive transfers generated by the BGP based method (false positives could be due to merger & acquisition, non-BGP speakers changing their upstream provider, non-BGP speaker acquiring an AS number, etc.). We will use IP-level path measurements from Ark monitors toward these prefixes before and after the apparent transfer to reveal topological signatures for both transferred and non-transferred prefixes. For example, if we observe no common sequence of networks on the paths toward a prefix before and after the transfer, but observe a common ingress point into the prefix (the first IP address in the destination prefix), this combination indicates a non-BGP speaker changing upstream providers, i.e., not a transfer. But lack of a common ingress point suggests a prefix transfer. We will define other path-based heuristics to filter false positives from the list of apparent transfers, and also to identify transfers based on collected path information. Our second approach is to use RTT measurements from Ark monitors toward IP addresses in apparent transferred prefixes as a form of constraint-based geolocation [92,10,51,34,81], assuming that large changes in inferred geographical location of prefixes may suggest a transfer or leasing event. To support this analysis, we will establish regular (every month or quarter) and consistent RTT and topology measurements from Ark monitors toward each routed prefix.3.1.2 Validation of detected transfers
We will use lists of published transfers from RIRs to validate and improve our techniques. We will cross-validate the inferences from the techniques described above to increase confidence in our inferences. We will regularly publish our list of inferred transfers online, and solicit ground truth from involved parties in order to validate our methodology. CAIDA has a history of successful interaction with operators, most notably through the AS-rank interface [24] for validation of AS relationships. Our collaborators at RIPE NCC will help validate our inferences using their data.3.1.3 Analyzing published and inferred transfers to inform our model
Quantitative characterization of the transfer market will help parameterize our model as well as inform debate on several contentious policy questions about the market's effects on IPv6 adoption: 1. Are IP addresses acquired to satisfy immediate need? Currently, RIRs try to enforce needs-based policies on transfers, suggesting that transferred prefixes would be advertised promptly. If market-driven transfers [56] prevail, then long latencies to observable use of acquired IPv4 addresses might indicate hoarding. We will measure the latency between an address block transfer and its appearance in global routing tables, and also measure the utilization of transferred address blocks before and after the inferred transfer. Both metrics will indicate whether the market activity is satisfying immediate needs. 2. Which organizations are involved in transfers? We will analyze which type of networks are buying and selling IPv4 addresses, e.g., access providers, providers in developing regions, new entrants vs. incumbents. We will also compare regional differences in address transfer behavior with address scarcity and IPv6 adoption across regions [32,9,40]. 3. How do prices of IP addresses evolve as the market grows? Sale prices of address blocks are generally not published, although some have appeared in public records, e.g, bankruptcy proceedings [74,52], and IPv4 address brokers (e.g., [2]) publish offered prices of available address blocks. We will periodically query broker websites for this information, and correlate prices with the number of available addresses. We will use this data to characterize the demand-supply and price characteristics of the IPv4 address market.3.1.4 Preliminary results
We have undertaken an initial study of IPv4 address block transfers based on lists published by the 3 largest RIRs [59], which revealed that 75% of transferred addresses come from legacy allocations, 85% of transferred address blocks appear in the routing table within six months of being transferred, and transferred prefixes are generally more lightly utilized (between 1 and 4% utilization, as compared to 10% for other prefixes) before the transfer. These initial results suggest that the market is thus far facilitating a healthy redistribution of address space, with little evidence of hoarding. But the market is growing rapidly (Figure 3) and merits periodic examination. We have experimented with the described BGP-based method to detect transfers and leases but it is noisy, yielding hundreds of apparent transfers per month. We designed a set of 10 filters to remove false positives, which for the interval we studied (2009-2013) reduced the number of apparent transfers by 86% while still detecting all documented transfers observable in BGP data (we published these first results in [59]). But 99.5% of the filtered apparent transfers were not in the RIR-published lists, demonstrating the need for better BGP-based filters and techniques from DNS or the data-plane to detect transfers. We have also done a preliminary analysis of historical DNS data [22,48] and its potential to infer, confirm, or rule out transfers. We found that the use of reverse DNS mappings (looking for changes in these mappings when they exist, which is for about 70% of /24 prefixes) reduced the filtered set of apparent transfers by a further 50%. We also found that the SOA record revealed ownership information for 90% of prefixes in CAIDA's July 2012 ITDK [22] that have no reverse mappings, and thus shows promise as an additional source of data. Our proposed reverse DNS and SOA lookups of the entire routed space will help us develop these methods. We have used IP path information continuously collected as part of CAIDA's macroscopic topology project [22] to develop topological signatures described previously (e.g, common sequence of networks before/after, and/or common ingress point into the transferred prefix); however, we were limited by the randomized nature of Ark probing, where a prefix may not be probed by the same Ark monitor before and after the transfer. Our proposed systematic probing of each prefix for IP path and RTT information will help us develop the data-plane methods.3.2 Characterizing Carrier Grade NAT (CGN) deployment and performance
We will develop methods to characterize CGN deployment and performance. Our measurements will illuminate, and thereby enable our model to capture, two opaque aspects of the infrastructure: who deploys CGN technology, and its potential to degrade performance for the user.3.2.1 Developing methods to detect CGNs
Passive server-side method: We propose to use patterns of IP addresses appearing in system logs of globally accessible services (e.g., speed tests, popular websites or Bittorrent) to infer whether a network has deployed a CGN device. The frequency of observing a given IP address is a function of user behavior, popularity of the service, and configuration of the network hosting the IP address, i.e, whether the network assigns static IP addresses, uses DHCP (which can change the IP address frequently) or deploys a CGN (in which case many customers are using the same IP address). The IP address statically assigned to a user is observed at the service when that user runs the test, but an address on the public side of a CGN is observed whenever any user behind the CGN runs the test. Our goal is to model the patterns by which IP addresses are observed in various configuration scenarios.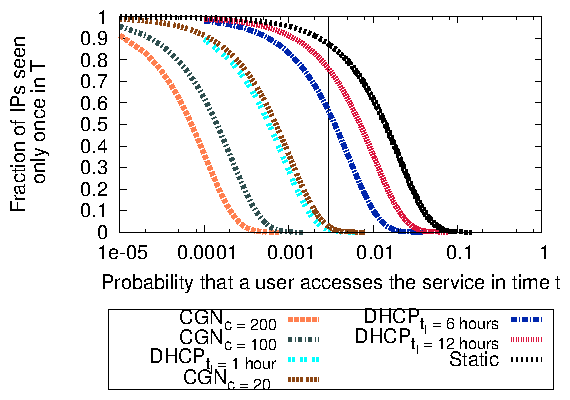
3.2.2 Validating our inferences of CGN deployments in the wild
We will adopt a multi-pronged approach to validate our inferences of CGN deployments. The FCC and SamKnows will help us directly validate the active client-side measurements. To validate our passive inferences we will contact network operators using their contacts from WHOIS and peeringDB [3], and include our inferences on CAIDA's AS-rank website [24] for feedback. We will explore further validation using: (1) DNS data; (2) BitTorrent data; and (3) alias resolution tools. We will perform reverse DNS lookups on all IPs passively observed from networks which we infer to deploy CGNs, and search the hostnames for strings indicative of CGN deployment (e.g., "CGN" "NAT"). From Bittorrent tracker crawls we will extract the number of torrents per IP address for networks in both (inferred) CGN and non-CGN sets. On CGN-enabled networks, the number of torrents associated with an IP will exceed the number of torrents shared by a typical user, since many users are sharing the same IP address. Finally, we will experiment with alias resolution tools [53] on IP addresses observed from inferred CGN and non-CGN networks. IP addresses from non-CGN networks should represent unique CPE devices (i.e., none of them should be aliases), while two IP addresses from the public side of the same CGN device should be inferred as aliases.3.2.3 Characterizing the prevalence, evolution, and performance impacts of CGNs
Several datasets we will use or generate in the course of CGN detection are available historically and continually, allowing us to analyze trends in types of networks (small/large access providers, mobile/wireline providers, incumbents/new entrants) deploying CGNs. Do some geographic regions tend to favor CGN deployment over IPv6? To ascertain whether CGN technology significantly degrades performance, we will use Mlab data gathered by the NDT and Mobiperf tools [67], and measure and compare performance characteristics such as delay, jitter, loss rate, and throughput from Ark and RIPE Atlas vantage points behind and not behind CGNs. A statistically significant difference is evidence that CGNs could be degrading performance. To measure the impact of CGNs on application breakage, we will extend the active measurement technique to simulate the behavior of applications (e.g., Xbox, peer-to-peer applications, and Netflix streaming). We will deploy this measurement suite on the Mlab infrastructure as well as on Bismark, FCC-Samknows, and Ark. These tests along with our inferences of CGN deployments will form the basis of a large-scale measurement study of application breakage due to CGNs.3.2.4 Preliminary results
We have applied the passive CGN detection method to 4 years of historical data (from 2010-2014) from Measurement Lab (Mlab) which consists of performance tests (e.g., NDT and Mobiperf), where the probability p of a user running a Mlab test in a time window of t=1 day is low enough to distinguish CGN from non-CGN cases (The vertical line in Figure 4 shows p extracted from Mlab data). From a sample of 1400 networks from which we observed enough Mlab tests to make an inference, our method inferred that 99 networks had deployed CGNs. We obtained limited validation of our inferences using reverse DNS names and bittorrent data. Our results indicate that the number of CGN deployments is increasing over time, with 7% of the measured networks inferred to have currently deployed a CGN. Only 2 out of 99 inferred CGN networks had acquired address space on the (documented) address market, while only 9% of those networks were observed in the IPv6 AS topology; i.e., networks are using CGN as an alternative to buying IPv4 addresses or deploying IPv6.4 Task 2: Design, implement and apply a computational model of IPv6 adoption
Our second task is to develop a model to reason about the impact of a number of factors (two of which we have proposed to measure and characterize in Task 1) on IPv6 adoption. A computational model of the decision process of an organization in deploying IPv6 has at least four modeling challenges: realistically representing players (agents) and their possible actions, capturing the costs of operating IPv4 and/or IPv6 infrastructure, formalizing and efficiently executing decisions of agents, and identifying an equilibrium. We explain how the model addresses these challenges (Section 4.1), how we will parameterize, implement, and validate the model (Section 4.2), and how we will use it to study real world questions about the future of the Internet (Section 4.3).4.1 Preliminary (simplified) model description
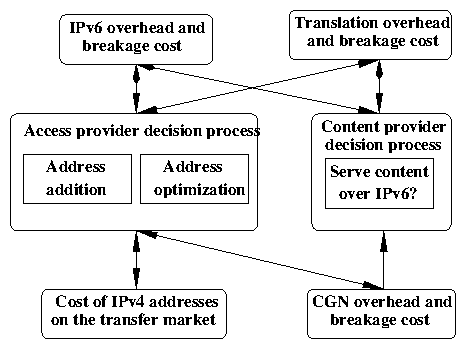
Active players: Content and access (including mobile) providers - the major stakeholders in the IPv6 transition - are the active (decision-making) players in our model; transit providers (most of whom have already deployed IPv6 [32]) will be passive players. Access providers earn revenues from their customers, while content providers earn revenue based on the number of end-users that access their content. Enterprises and universities are access providers since their users implicitly or explicitly pay for Internet access at those organizations. We model the number of end-users that each access provider serves, and the popularity of each content provider that end-users access. Granularity: It is critical to model the ability for organizations to incrementally deploy IPv6, so we consider IPv6 deployment at the granularity of individual customers, i.e., end-user devices that need IP addresses. In the case of wired broadband, a CPE device corresponds to a single instance of an IP addressing need. An access network will have a set of customer devices numbered in different ways. We define device classes based on the nature of addresses used to number those devices, i.e., public IPv4 address, NAT IPv4 address, only IPv6 address, dual-stacked with a NAT IPv4 address, or dual-stacked with a public IPv4 address. Costs associated with IPv4 or IPv6: We describe our initial approach to modeling the costs associated with IPv6 deployment or satisfying addressing needs with IPv4-based technologies. Section 4.2 describes how we will ground the following cost functions in empirical data. Cost of purchasing IPv4 addresses on the market: We model the presence of IPv4 address transfer markets as a way for networks to satisfy their network growth requirements. We assume that the cost of acquiring IPv6 addresses is zero. CGN capital overhead and breakage cost: CGN deployment requires capex and opex (the cost of purchasing and operating equipment), which we term capital overhead. We also model a breakage probability to capture any poor performance and/or application breakage when accessing certain services from behind a CGN. IPv4-IPv6 translation capital overhead and breakage cost: Customers with IPv6 addresses will require translation to communicate with IPv4-only content. As with the CGN cost, we model translation costs as capital overhead (deploying translation equipment) plus breakage costs, based on the breakage probability of transition technologies. Dual-stacked devices support both IPv4 and IPv6 by design, and thus incur no translation costs. IPv6 capital overhead and breakage cost: We model IPv6 costs as the combination of capital overhead (new hardware, support, labor, etc.) and breakage, e.g., additional latency due to dual-stack failover to IPv4 or poor performance over IPv6. Total cost: The total cost for an access provider depends on the number of customers in different device classes, the capital overheads associated with those classes, and breakage probability (which depends on the device classes of its customers and also of content providers). For an access provider, breakage can result in loss of customers or additional expenses due to service requests or support calls [45]. For a content provider, the total cost depends on its own state (IPv4 only or dual-stacked), and any potential breakage due to clients from different device classes accessing its content. For both access and content providers, we model the total cost as the fraction of revenue lost due to capital overheads and breakage. Decision Process: We model networks as selfish agents that attempt to minimize their costs, subject to external factors, i.e., a myopic best-response dynamic. Note that the utility function is purely determined by costs.- Access provider decision process: The provider assigns IP addresses to customers in various device classes to minimize total cost subject to the current market price of IPv4 addresses, and costs related to breakage of CGN, translation technologies, or IPv6 issues. These costs depend on the device classes of customers as well as content providers.
- Content provider decision process: The provider has two options: make content available on IPv6 and IPv4, or just IPv4. At each iteration, the content provider chooses the configuration (either IPv4-only or dual-stack) with the lowest estimated capital overhead plus breakage cost.
4.2 Refining, Implementing and Validating the Model
Parsimonious, yet realistic modeling: Modeling a system as complex and heterogeneous as the Internet is a delicate balancing act between parsimony and realism. The goal of a model is not to duplicate reality, but rather to capture the most important features of the real world and ignore effects that are less likely to have a macroscopic impact. We will follow an iterative approach to developing the model, adding (and removing) parameters, costs, and possible player actions from the preliminary model. At each iteration of the model, we will test the impact of each parameter using standard techniques from Design of Experiments (DoE) [70], and then remove parameters with negligible impact on the final outputs. The PI has extensive experience in agent-based modeling [30,31,61,62,63,64] using an iterative approach to model development. Refining and empirically grounding parameters of the model: Our goal with parameterizing the model is not to obtain the precise values of all parameters, but to enable an exploratory sweep of the value space of these parameters to study how they individually and in combination influence outcomes. For factors related to the IPv4 address market dynamics, we will use our characterization of the transfer market (Section 3.1). We will use data from our measurements of CGN performance (Section 3.2) to estimate a realistic breakage probability for customers behind a CGN or translation technologies. To parameterize IPv6 breakage, we will use existing measurements of client-side IPv6 performance and breakage [9,76,32]. To compute loss of revenue from breakage probabilities, we will use an approach similar to Howard [45], who estimated the cost of breakage in relation to a customer's broadband subscription fee. To estimate capital overhead (as a fraction of revenue) due to CGN, translation technologies and IPv6, we will rely on our surveys (see below), and material published at operational venues [45,44]. To obtain values for access network growth, we will use SEC filings by public companies and surveys of global broadband penetration, growth, and market shares [88,78,17]. The agent-based nature of our model enables us to restrict the set of actions allowed by players depending on their type. For example, we can restrict purchase of IP addresses on the market, or CGN deployment, to only those types of networks that we observe engaging in those behaviors (Section 3.1, 3.2). We can also assign players a geographic region, and configure region-specific parameters based on our measurements. Surveys: Various components of the model will benefit from input directly from network operators. We published a survey to various operational venues (NANOG, RIPE, etc.) in Spring 2012, soliciting information from network operators such as: type of business, number of customers, number of IPv4 and IPv6 addresses held, the fraction of addresses in different address classes, size and overhead of CGN deployment, anticipated future address needs, and anticipated approach to satisfying those needs. We received responses from 65 network operators that yielded insight into these parameters. For example, 50% of responses included purchasing addresses on the market as an option, 12% included deploying CGN, while 58% included deploying IPv6 (The full analysis of that survey is available as a technical report [60]). We will repeat this survey each year of this project, refining the questions based on the responses we receive. Implementing an agent-based simulation framework: As a design principle, the model sacrifices analytical tractability in favor of realism, so we must resort to simulations to determine the equilibrium that results from a given parameterization. We have several design goals for this simulator. First, it must be scalable, allowing us to simulate an ecosystem that approaches the size of the current Internet (approximately 50,000 networks). Second, it must be extremely efficient, since we will need to sweep several parameter spaces. We will investigate the possibility of parallelizing components of the simulator, leveraging NSF-funded HPC resources at SDSC [85,86]. Finally, the simulator must be extensible, allowing us to configure and parameterize what-if scenarios, and refine the decision processes and other components of the model as we receive feedback from the research and operational community. Validating the model: Our model attempts to capture the optimal decision processes of individual organizations. We do not expect each network to behave according to this model, nor that we can use this model to predict whether a particular network will adopt IPv6. Instead, we will use the model to predict macroscopic outcomes, e.g, IPv6 adoption by different classes of providers, similar to our previous work using agent-based modeling [30,61,62,63,64]. We will parameterize the model with the best data we can obtain about distributions of network types and cost estimates. We will then compute the equilibrium that the model produces, and whether the predicted IPv6 adoption by content and access providers is qualitatively similar to that seen in real data, based on published studies of IPv6 adoption according to business type [32,95]. The fine granularity of our model will enable us to compare the fraction of end-users in different address classes as predicted by our model with measurement data about users behind CGN (Section 3.2) and users with IPv6 capability [9,40]. We will simulate well-known events in the past, such as the IPv6 launch day [4], when hundreds of content providers switched on IPv6 capability, resulting in a large jump in IPv6 deployment in terms of IPv6-capable clients and IPv6 traffic. We will simulate this event by forcing the largest content providers in the simulation to offer content over IPv6, and verify whether it is able to reproduce the jump in IPv6 deployment that followed the launch day. Convergence properties, equilibria, and "Out of equilibrium" analysis: An advantage of agent-based (as opposed to analytical) modeling is that it enables out of equilibrium analysis, i.e., studying the process by which an equilibrium (if it exists) is reached. Out of equilibrium analysis often produces useful insights, e.g., identifying system trajectories that lead to inevitable equilibria (outcomes from which the system cannot escape), or the the ability of certain players making the "right move at the right time" to significantly affect the eventual outcome. Agent-based simulations also allow analysis of non-equilibria. When a simulation does not converge because the system oscillates among a set of states, we will study whether the oscillations are due to plausible real-world effects or simulation artifacts, and the extent to which the effects are local or global, based on how many players are involved in the oscillation. When an equilibrium exist, we will study its stability by perturbing the system to see if it re-converges to the same equilibrium. Multiple equilibria are possible in agent-based systems [12], and can depend on initial conditions or the playing sequence. While equilibria can differ at the microscopic level (i.e., the states of individual networks may be different across equilibria), the important question is whether the equilibria are qualitatively similar (in terms of macroscopic properties), since in that case we can make generalizable conclusions about the overall outcome. Our previous agent-based simulation models [30,61,62,63,64] have followed this approach and were successful in producing insights about macroscopic topology, traffic flow, and economics in the Internet interdomain ecosystem (Section ).4.3 Implications of the modeling results for IPv6 adoption
The computational nature of our model will enable us to investigate "what-if" scenarios related to IPv6 deployment, by quantifying the effect of various factors - individually or in combination - and under what conditions such factors play a determinative role. Operators, standards bodies and policy makers can use this model to optimize investments to achieve desirable outcomes. We describe next a preliminary set of what-if scenarios we plan to evaluate in this work. We will compare our results with those of previous analytical models [75,50,49], and examine the extent to which factors not considered in previous studies reinforce or refute their conclusions. Cost structures: We will systematically evaluate the relative impact of cost components - IPv4 address costs, and breakage costs due to CGN, transition technologies, and IPv6 - and their combinations - on the resulting equilibrium. We will answer questions such as how much smaller the IPv6 breakage cost must be relative to other costs, in order for widespread IPv6 deployment to happen. These results will provide performance targets for network operators. Content popularity: We will investigate what-if scenarios with various distributions of content provider popularity and access provider size (number of subscribers), and the extent to which skewed distributions of these variables can affect IPv6 adoption dynamics. Out-of-equilibrium analysis will support inquiries such as: should popular content providers make content available over IPv6 - even if they suffer temporary breakage - with the expectation that it will foster widespread IPv6 adoption and overall better performance in the future? Address markets: We will model speculation and address hoarding, and their effects on resulting equilibria. Does the IPv4 address market, if freed from needs-based policies, inhibit IPv6 adoption? Results from this scenario will inform the ongoing controversy over the risks and benefits of address markets [56], and guide RIRs policies related to these markets. Pressure from new entrants: We will simulate post-IPv4 exhaustion dynamics, i.e., when all new networks must obtain IPv4 space on the address market, or deploy IPv6. This scenario is important with the emergence of mobile access providers, especially in emerging economies with millions of customers. We will investigate at what point the growth of new IPv6-only networks creates sufficient incentive for content providers and existing access networks to deploy IPv6 in order to communicate with new entrants without using transition technologies. Results of this scenario will guide new entrants in choosing between buying IPv4 addresses, deploying IPv6, or using CGNs. Evolutionary trends in costs and performance: We will implement scenarios in the model to examine how trends in real-world costs and performance affect IPv6 deployment. The resulting analysis will predict how IPv6 deployment is likely to evolve if different cost parameters continue to evolve as they do now. To extend this analysis, we will experiment by changing those trends, e.g., to simulate what would happen if IPv6 performance degrades or improves over time, or CGNs become increasingly overloaded and cause performance degradation. Regulation: One goal of our model is to investigate the conditions under which market forces and cost structures alone are sufficient to drive IPv6 deployment. An absence of any market-based scenario that leads to substantial IPv6 deployment in equilibrium will further support the market failure argument [46] that some form of public sector intervention is necessary to achieve global IPv6 deployment. We can also use the model to evaluate how specific regulation (e.g., by region [80], or by network type) will likely affect the outcome.4.4 Generalizing the model to other technology transitions
While the model as presented is IPv6-specific, the agent-based simulation approach is general, and can be applied to other problem domains. For instance, there is significant recent interest in the design of a new Internet architecture, e.g., [99,91,7,97,73]. Transitioning from the current Internet architecture to a new one would face many of the same problems as the IPv4-to-IPv6 transition, e.g., lack of backward compatibility, possible breakage of applications running on the new architecture, and investment required by stakeholders with no immediate benefits. We will investigate how we or others can adapt and extend our model to other technology transitions, with the NSF-funded future Internet architectures (FIA) as case studies [72].5 Curriculum Development
Graduate and undergraduate curricula in computer networking typically focus mostly on the technical aspects of routing, addressing, and protocols/architectures, with little focus on economic and policy aspects. Yet the IPv6 transition has stalled mostly for lack of economic or other incentives, e.g., policy directives. The PIs will use results of this project to introduce economic/policy aspects underlying technology transitions into networking curricula. We will create accessible educational materials (e.g., slidesets, animations, videos, and online classroom modules) describing our latest understanding of IPv6 deployment and performance. These educational materials as well as data and tools released over the course of this project can be used in lectures and seminars on empirical and theoretical underpinnings of the Internet. We will advertise these resources on the project web site and in relevant publications, conferences, and workshops.References
- [1]
- IP Trading. http://www.iptrading.com/.
- [2]
- IPv4 Market Group. http://ipv4marketgroup.com/.
- [3]
- PeeringDB. www.peeringdb.com.
- [4]
- World IPv6 Launch, June 2012. http://www.worldipv6launch.org/.
- [5]
- ARIN Number Resource Policy Manual, Section 8: Transfers, 2013. https://www.arin.net/policy/nrpm.html#eight.
- [6]
- S. Alcock, R. Nelson, and D. Miles. Investigating the Impact of Service Provider NAT on Residential Broadband Users. Technical report, 2010.
- [7]
- T. Anderson, K. Birman, R. Broberg, M. Caesar, D. Comer, C. Cotton, M. J. Freedman, A. Haeberlen, Z. G. Ives, A. Krishnamurthy, W. Lehr, B. T. Loo, D. Mazières, A. Nicolosi, J. M. Smith, I. Stoica, R. van Renesse, M. Walfish, H. Weatherspoon, and C. S. Yoo. A brief overview of the nebula future internet architecture. ACM SIGCOMM Computer Communications Review, 44(3):81-86, July 2014.
- [8]
- APNIC. APNIC Transfer, Merger, Acquisition, and Takeover Policy. http://www.apnic.net/policy/transfer-policy.
- [9]
- APNIC. Measuring IPv6. http://labs.apnic.net/measureipv6/.
- [10]
- M. Arif, S. Karunasekera, S. Kulkarni, A. Gunatilaka, and B. Ristic. Internet Host Geolocation Using Maximum Likelihood Estimation Technique. In AINA '10: Proceedings of the 2010 24th IEEE International Conference on Advanced Information Networking and Applications, Washington, DC, USA, 2010. IEEE Computer Society.
- [11]
- ARIN. Inter-RIR Transfers. https://www.arin.net/resources/registry/transfers/.
- [12]
- W. B. Arthur. Chapter 32 Out-of-Equilibrium Economics and Agent-Based Modeling. volume 2 of Handbook of Computational Economics. Elsevier, 2006.
- [13]
- F. M. Bass. A New Product Growth for Model Consumer Durables. Management Science, 15(5):215–227, 1969.
- [14]
- I. V. Beijnum. Trading IPv4 Addresses Will End in Tears. Ars Technica, 2011. http://arstechnica.com/tech-policy/2011/08/trading-ipv4-addresses-will-end-in-tears/.
- [15]
- I. V. Beijnum. IPv4 Address Transfer Markets are Forming where we Least Expected. Ars Technica, 2012. http://arstechnica.com/tech-policy/2012/09/ipv4-address-transfer-markets-are-forming-where-we-least-expected/.
- [16]
- I. V. Beijnum. IPv6 takes one step forward, IPv4 two steps back in 2012. Ars Technica, 2013. http://arstechnica.com/business/2013/01/ipv6-takes-one-step-forward-ipv4-two-steps-back-in-2012/.
- [17]
- Y. Benkler. Next Generation Connectivity: A Review of Broadband Internet Transitions and Policy from Around the World. The Berkman Center for Internet and Society Technical Report, 2010.
- [18]
- A. Biggadike, D. Ferullo, G. Wilson, and A. Perrig. NATBLASTER: Establishing TCP Connections Between Hosts Behind NATs. In Proceedings of ACM SIGCOMM Asia Workshop, 2005.
- [19]
- D. Bowman. World IPv6 Day...We Have Liftoff, June 2012. https://www.internetsociety.org/news/press-releases/2012/world-ipv6-launch-solidifies-global-support-for-new-internet-protocol/.
- [20]
- L. M. Cabral. On the Adoption of Innovations with Network Exrnalities. Mathematical Social Sciences, 19(3), 1990.
- [21]
- CAIDA. Exploring the Evolution of IPv6: Topology, Performance, and Traffic. National Science Foundation Research Grant. https://www.caida.org/funding/nets-ipv6/.
- [22]
- CAIDA. Internet Topology Data Kit (ITDK). https://www.caida.org/catalog/datasets/internet-topology-data-kit/.
- [23]
- CAIDA. IPv4 Routed /24 DNS Names Dataset. https://www.caida.org/catalog/datasets/ipv4_dnsnames_dataset/.
- [24]
- CAIDA. Ranking of Internet Service Providers by Observed Topology, 2005. https://asrank.caida.org/.
- [25]
- J. P. Choi. Do Converters Facilitate the Transition to a new Incompatible Technology? A Dynamic Analysis of Converters. International Journal of Industrial Organization, 14(6), October 1996.
- [26]
- J. P. Choi. The Provision of (Two-way) Converters in the Transition Process to a New Incompatible Technology. The Journal of Industrial Economics, 45(2), 1997.
- [27]
- K. Claffy. Exhausted IPv4 Address Architectures. CAIDA Blog, 2010. https://blog.caida.org/best_available_data/2011/05/03/exhausted-ipv4-address-architectures/.
- [28]
- J. Czyz, M. Allman, J. Zhang, S. Iekel-Johnson, E. Osterweil, and M. Bailey. Measuring IPv6 Adoption. In Proceedings of ACM SIGCOMM, 2014.
- [29]
- A. Dainotti, K. Benson, A. King, k claffy, M. Kallitsis, E. Glatz, and X. Dimitropoulos. Estimating Internet Address Space Usage Through Passive Measurements. ACM SIGCOMM Computer Communications Review (CCR), 2014.
- [30]
- A. Dhamdhere and C. Dovrolis. The Internet is Flat: Modeling the Transition from a Transit Hierarchy to a Peering Mesh. In Proceedings of ACM CoNEXT, Dec. 2011.
- [31]
- A. Dhamdhere, C. Dovrolis, and P. Francois. A Value-based Framework for Internet Peering Agreements. In International Teletraffic Congress (ITC), Amsterdam, The Netherlands, Oct 2010.
- [32]
- A. Dhamdhere, M. Luckie, B. Huffaker, A. Elmokashfi, K. Claffy, and E. Aben. Measuring the Deployment of IPv6: Topology, Routing, and Performance. In Proceedings of the ACM SIGCOMM Internet Measurement Conference (IMC), Nov 2012.
- [33]
- A. Dul. Economics of IPv4 Markets on IPv6 Deployment. NANOG 53, 2011. http://www.nanog.org/meetings/nanog53/presentations/Wednesday/Dul.pdf.
- [34]
- B. Eriksson, P. Barford, B. Maggs, and R. Nowak. Posit: A Lightweight Approach for IP Geolocation. ACM SIGMETRICS Performance Evaluation Review, 40(2), Oct. 2012.
- [35]
- J. Farrell and G. Saloner. Converters, Compatibility, and the Control of Interfaces. Journal of Industrial Economics, 40(1), March 1992.
- [36]
- Fildes, Robert. New-Product Diffusion Models. International Journal of Forecasting, 19(2), 2003.
- [37]
- B. Ford, P. Srisuresh, and D. Kegel. Peer-to-peer Communication Across Network Address Translators. In Proceedings of the USENIX Annual Technical Conference, 2005.
- [38]
- L. A. Fourt and J. W. Woodlock. Early Prediction of Market Success for Grocery Products. Journal of Marketing, 25, 1960.
- [39]
- G. Huston. IPv4 Address Report, 2011. http://www.potaroo.net/tools/ipv4/index.html.
- [40]
- Google. IPv6 Adoption Statistics, 2015. http://www.google.com/ipv6/statistics.html.
- [41]
- S. Guha and P. Francis. Characterization and Measurement of TCP Traversal Through NATs and Firewalls. In Proceedings of the ACM SIGCOMM Internet Measurement Conference (IMC), 2005.
- [42]
- D. Horsky. A Diffusion Model Incorporating Product Benefits, Price, Income and Information. Marketing Science, 9(4), 1990.
- [43]
- A. Hovav, R. Patnayakuni, and D. Schuff. A model of Internet Standards Adoption: The case of IPv6. Information Systems Journal, 14(3), 2004.
- [44]
- L. Howard. The Cost of IPv6. http://www.nanog.org/meetings/nanog57/presentations/Tuesday/tues.general.IPv4IPv6Howard.21.pdf.
- [45]
- L. Howard. Total Cost of Ownership of Carrier-Grade NAT. http://rmv6tf.org/wp-content/uploads/2012/11/TCO-of-CGN1.pdf.
- [46]
- G. Huston. An Economic Perspective on the IPv6 Transition, 2011. https://www.caida.org/workshops/wie/1112/slides/wie1112_ghuston.pdf.
- [47]
- International Computer Science Institute. Measuring and Modeling the Dynamics of IPv4 Address Exhaustion. National Science Foundation Research Grant. http://www.nsf.gov/awardsearch/show-award?AWD_ID=1111672.
- [48]
- Internet Systems Consortium. Domain Survey. https://www.isc.org/services/survey/.
- [49]
- Y. Jin, S. Sen, R. Guérin, K. Hosanagar, and Z.-L. Zhang. Dynamics of Competition Between Incumbent and Emerging Network Technologies. In Proceedings of NetEcon, 2008.
- [50]
- D. Joseph, N. Shetty, J. Chuang, and I. Stoica. Modeling the Adoption of new Network Architectures. In Proceedings of ACM CoNEXT, 2007.
- [51]
- E. Katz-Bassett, J. John, A. Krishnamurthy, D. Wetherall, T. Anderson, and Y. Chawathe. Towards IP Geolocation Using Delay and Topology Measurements. In Proceedings of the ACM SIGCOMM Internet Measurement Conference (IMC), 2006.
- [52]
- Kevin Murphy. Bankrupt Borders flogs 65,536 IP addresses at $12 a Pop. http://www.theregister.co.uk/2011/12/05/borders_flogs_ipv4_addys/.
- [53]
- K. Keys, Y. Hyun, M. Luckie, and k. claffy. Internet-Scale IPv4 Alias Resolution with MIDAR. IEEE/ACM Transactions on Networking, 21(2):383-399, Apr 2013.
- [54]
- A. Knutsen, R. Frederick, J. Mahdavi, Q. Li, and W. Yeh. TCP Option for Transparent Middlebox Discovery. Internet Draft: draft-knutsen-tcpm-middlebox-discovery-04.txt, May 2010.
- [55]
- C. Kreibich, N. Weaver, B. Nechaev, and V. Paxson. Netalyzr: Illuminating the Edge Network. In Proceedings of the ACM SIGCOMM Internet Measurement Conference (IMC), 2010.
- [56]
- B. Kuerbis, M. Mueller, and H. Asghari. In the Eye of the Beholder: The Role of Needs-Based Assessment in IP Address Market Transfers. In Proceedings of TPRC, 2013.
- [57]
- T. B. Lee. The Case for a Free Market in IPv4 Addresses. Ars Technica, 2011. http://arstechnica.com/tech-policy/2011/08/the-case-for-a-free-market-in-ipv4-addresses/.
- [58]
- W. Lehr, T. Vest, and E. Lear. Running on Empty: The Challenge of Managing Internet Addresses. In Proceedings of TPRC, 2008.
- [59]
- I. Livadariu, A. Elmokashfi, A. Dhamdhere, and K. Claffy. A First Look at IPv4 Transfer Markets. In Proceedings of ACM CoNEXT, Dec. 2013.
- [60]
- I. Livadariu, A. Elmokashfi, A. Dhamdhere, and K. Claffy. Analysis of IPv6 deployment survey responses. CAIDA Technical Report, 2013. https://www.caida.org/~amogh/papers/ipv6survey2012_analysis.pdf.
- [61]
- A. Lodhi, A. Dhamdhere, and C. Dovrolis. GENESIS: An Agent-based Model of Interdomain Network Formation, Traffic Flow and Economics. In Proceedings of IEEE Infocom, Mar. 2012.
- [62]
- A. Lodhi, A. Dhamdhere, and C. Dovrolis. GENESIS-CBA: an agent-based model of peer evaluation and selection in the internet interdomain network. Complex Adaptive Systems Modeling, 1(10):1-29, Apr 2013.
- [63]
- A. Lodhi, A. Dhamdhere, and C. Dovrolis. Open Peering by Internet Transit Providers: Peer Preference or Peer Pressure? In Proceedings of IEEE Infocom, Mar. 2014.
- [64]
- A. Lodhi, N. Laoutaris, A. Dhamdhere, and C. Dovrolis. Complexities in Internet Peering: Investigating the Black Art. In Proceedings of IEEE Infocom, Mar. 2015.
- [65]
- M. Bagnulo and A. Sullivan and P. Matthews and I. van Beijnum. DNS64: DNS extensions for Network Address Translation from IPv6 Clients to IPv4 Servers, October 2010. http://tools.ietf.org/html/draft-ietf-behave-dns64-11.
- [66]
- M. Bagnulo and P. Matthews and I. van Beijnum. Stateful NAT64: Network Address and Protocol Translation from IPv6 Clients to IPv4 Servers, July 2010. http://tools.ietf.org/html/draft-ietf-behave-v6v4-xlate-stateful-12.
- [67]
- M. Mao, J. Huang, S. Huang, H. Luo, T. Andrews, S. Rosen, A. Nikravesh, H. Yao, D. Choffnes, S. Han, M. Welsh, D. Hamon, T. Refice, and M. Whittaker. Mobiperf. https://www.measurementlab.net/tests/mobiperf/.
- [68]
- C. D. Marsan. US Feds: We will meet June IPv6 deadline. ComputerWorld, April 2008. http://www.computerworld.com.au/article/210954/us_feds_we_will_meet_june_ipv6_deadline/.
- [69]
- C. D. Marsan. IPv6 Traffic Rises in U.S., but Remains Sliver of Overall Internet, Sept 2012. https://www.arnnet.com.au/article/437273/.
- [70]
- R. Mason, R. Gunst, and J. Hess. Statistical Design and Analysis of Experiments, with Applications to Engineering and Science. 2003.
- [71]
- M. Mueller, B. Kuerbis, and H. Asghari. Dimensioning the Elephant: An Empirical Analysis of the IPv4 Number Market. In Proceedings of TPRC, 2012.
- [72]
- National Science Foundation. Future Internet Architecture Program. http://nets-fia.net/.
- [73]
- D. Naylor, M. K. Mukerjee, P. Agyapong, R. Grandl, R. Kang, M. Machado, S. Brown, C. Doucette, H.-C. Hsiao, D. Han, T. H.-J. Kim, H. Lim, C. Ovon, D. Zhou, S. B. Lee, Y.-H. Lin, C. Stuart, D. Barrett, A. Akella, D. Andersen, J. Byers, L. Dabbish, M. Kaminsky, S. Kiesler, J. Peha, A. Perrig, S. Seshan, M. Sirbu, and P. Steenkiste. Xia: Architecting a more trustworthy and evolvable internet. ACM SIGCOMM Computer Communications Review, 44(3):50-57, July 2014.
- [74]
- Network World. Microsoft Pays Nortel $7.5 million for IPv4 Addresses, 2011. http://www.networkworld.com/community/blog/microsoft-pays-nortel-75-million-ipv4-address.
- [75]
- M. Nikkhah and R. Guerin. Migrating to IPv6: The Role of Basic Coordination. In Proceedings of IFIP Networking, 2014.
- [76]
- M. Nikkhah, R. Guérin, Y. Lee, and R. Woundy. Assessing IPv6 Through Web Access a Measurement Study and Its Findings. In Proceedings of ACM CoNEXT, 2011.
- [77]
- L. Nobile. ARIN Policy Implementation and Experience Report. https://www.arin.net/participate/meetings/reports/ARIN_31/PDF/monday/nobile_policy.pdf.
- [78]
- OECD. Broadband Growth and Policies in OECD Countries. http://www.oecd.org/internet/broadband/40629067.pdf.
- [79]
- E. Osterweil, S. Amante, D. Massey, and D. McPherson. The Great IPv4 Land Grab: Resource Certification for the IPv4 Grey Market. In Proc. HotNets-X, 2011.
- [80]
- PC World. India Plans to Introduce IPv6 by 2012, 2010. http://www.pcworld.com/businesscenter/article/201573/india_plans_to_introduce_ipv6_by_2012.html.
- [81]
- A. Rasti, N. Magharei, R. Rejaie, and W. Willinger. Eyeball ASes: From Geography to Connectivity. ACM SIGCOMM Internet Measurement Conference (IMC), November 2010.
- [82]
- RIPE Labs, Robert Kisteleki. RIPE Atlas, February 2011. https://atlas.ripe.net/doc/udm.
- [83]
- RIPE NCC. IP Address Allocation and Assignment Policies for the RIPE NCC Service Region. http://www.ripe.net/ripe/docs/ripe-553.
- [84]
- J. Rosenberg, R. Mahy, P. Matthews, and D. Wing. Session Traversal Utilities for NAT (STUN). RFC 5389, October 2008.
- [85]
- San Diego Supercomputer Center. SDSC Welcomes 'Gordon' Supercomputer as a Research Powerhouse, December 2011. http://www.sdsc.edu/News%20Items/PR120711_gordon.html.
- [86]
- San Diego Supercomputer Center. SDSC's Trestles Provides Rapid Turnaround and Enhanced Performance for Diverse Researchers, July 2011. http://www.sdsc.edu/News%20Items/PR071411_trestles.html.
- [87]
- S. Sen, Y. Jin, R. Guerin, and K. Hosanagar. Modeling the Dynamics of Network Technology Adoption and the Role of Converters. IEEE/ACM Transactions on Networking, 2011.
- [88]
- Statista. Broadband Internet Subscriber Numbers in the U.S. 2011-2013, by cable provider. http://www.statista.com/statistics/217348/us-broadband-internet-susbcribers-by-cable-provider/.
- [89]
- S. Sundaresan, S. Burnett, N. Feamster, and W. De Donato. Bismark: A testbed for deploying measurements and applications in broadband access networks. In Proceedings of the USENIX Annual Technical Conference, pages 383-394, Berkeley, CA, USA, 2014. USENIX Association.
- [90]
- U.S. Executive Office of the President, Office of Management and Budget. Memorandum for Chief Information Officers of Executive Departments and Agencies, September 2010. https://obamawhitehouse.archives.gov/sites/default/files/omb/assets/memoranda_2010/m10-15.pdf.
- [91]
- A. Venkataramani, J. F. Kurose, D. Raychaudhuri, K. Nagaraja, M. Mao, and S. Banerjee. Mobilityfirst: A mobility-centric and trustworthy internet architecture. ACM SIGCOMM Computer Communications Review, 44(3):74-80, July 2014.
- [92]
- Y. Wang, D. Burgener, M. Flores, A. Kuzmanovic, and C. Huang. Towards Street-Level Client-Independent IP Geolocation. In Proceedings of USENIX NSDI, March 2011.
- [93]
- Z. Wang, Z. Qian, Q. Xu, Z. Mao, and M. Zhang. An Untold Story of Middleboxes in Cellular Networks. In Proceedings of ACM SIGCOMM, 2011.
- [94]
- Wikipedia. IPv6 transition mechanisms. http://en.wikipedia.org/wiki/IPv6_transition_mechanisms.
- [95]
- D. Wing. AAAA and IPv6 Connectivity Statistics of Top Websites According to Alexa, 2013. http://www.employees.org/~dwing/aaaa-stats/.
- [96]
- D. Wing, S. Cheshire, M. Boucadair, R. Penno, and P. Selkirk. Port Control Protocol (PCP). RFC 6887, Apr. 2013.
- [97]
- T. Wolf, J. Griffioen, K. L. Calvert, R. Dutta, G. N. Rouskas, I. Baldin, and A. Nagurney. Choicenet: Toward an economy plane for the internet. ACM SIGCOMM Computer Communications Review, 44(3):58-65, July 2014.
- [98]
- Y. Hyun and CAIDA. Archipelago Measurement Infrastructure, 2009. https://www.caida.org/projects/ark/.
- [99]
- L. Zhang, A. Afanasyev, J. Burke, V. Jacobson, k. claffy, P. Crowley, C. Papadopoulos, L. Wang, and B. Zhang. Named data networking. ACM SIGCOMM Computer Communications Review, 44(3):66-73, July 2014.
Footnotes:
1 Brokers (e.g., [1]) offer short-term IP address leases 2 We use f1 as a simple illustrative first step; we will investigate a broader range of statistics that can be used to derive the required metric.File translated from TEX by TTH, version 4.03.
On 22 Sep 2015, 12:49.