The contents of this legacy page are no longer maintained nor supported, and are made available only for historical purposes.
Internet Atlas Gallery
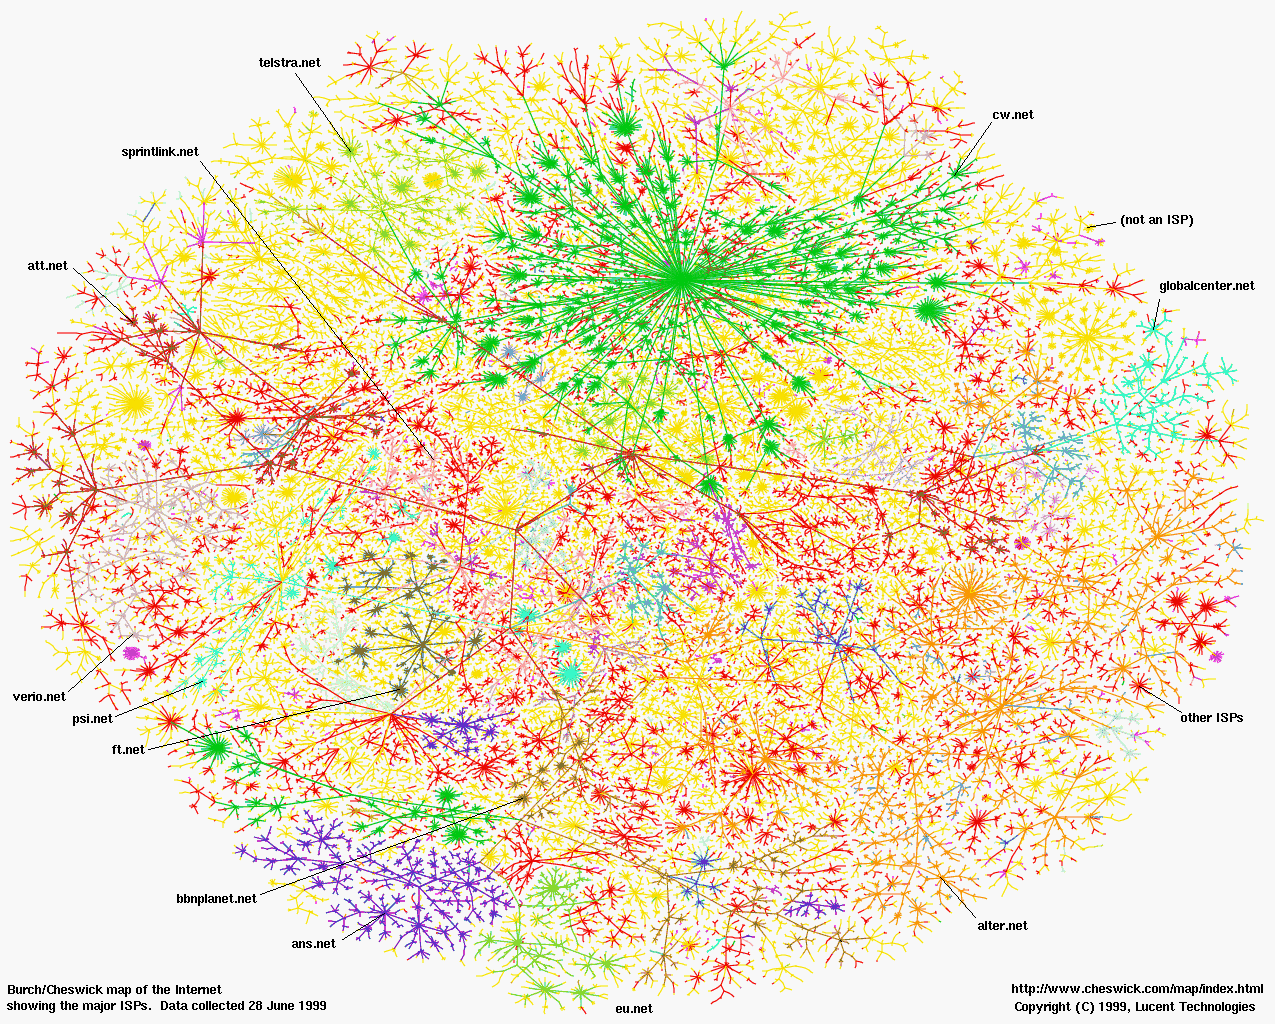
Layout Showing the Major ISPs
Bill Cheswick, Bell Labs and Hal Burch, CMU
Lucent Technologies Bell Labs Innovations
Carnegie Mellon University (CMU) Computer Science Dept.
URL:
https://www.bell-labs.com/about/history/#gref
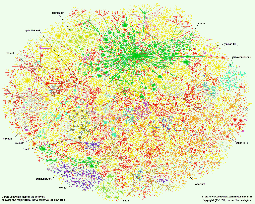
| Visualization Thumbnail |
About the Visualization |
 |
Visualization Techniques:
(Technique1):
Graph layout treats data as a physical system and finds the set of node
positions that minimizes the total energy. Any two nodes that do not share an
edge are connected, via infinite strings, to a spring. If the nodes are
further apart
than the spring's resting length, no force is applied. If the nodes are closer
than the spring's resting length, the spring is compressed and the nodes are
pushed apart. Minimum total energy is found using a gradient descent
algorithm.
(Technique2):
Graph layout occurs one layer at a time starting with closest links, and then
adding one hop at a time.
(Technique3): A decision is made whether to show all the paths or just
the minimum distance spanning tree (considering only the shortest path to
each destination).
|
Key Visualization Mappings:
(Mapping1): Color groups each ISP. (Layout can be colored in many ways: geographic region,
network capacity, distance from test host, IP address, etc.)
|
Visualization Tools:
(Tool1) Standard Unix text filters.
(Tool2): Proprietary graph layout and mapping program.
|
|
| Full-Size Visualization
|
Back |

