

Internet Atlas Gallery
Maps and Visualizations
-
Abilene Weather Map (using MRTG data)
by Indiana University Network Operations Center (Mark Meiss) -
World-Wide Mapping: Reverse traceroute or looking glass Servers
by CAIDA (Wilfred Dittmer) - Graphical Traceroute (GTrace)
by CAIDA (Ram Periakaruppen) - AS Core Network
by CAIDA - Layout Showing the Major ISPs
by Bill Cheswick and Hal Burch - Mbone Tunnels of the Major ISP Networks
by Tamara Munzner, Eric Hoffman, kc claffy, and Bill Fenner - skitter Data Using hypviewer
by Tamara Munzner and Daniel McRobb - NSFNET growth until 1995
by Donna Cox and Robert Patterson
Additional Content
Skitter data using Hypviewer: Internet Atlas Gallery
skitter Data Using hypviewer
Cooperative Association for Internet Data Analysis (CAIDA)San Diego Supercomputer Center (SDSC)
University of California, San Diego (UCSD)
This image shows that many paths from our skitter source monitor (riesling.caida.org) traverse 204.70.1.197. The source is not visible, but is in one of the clouds to the left of the sphere. Note the high outdegree of 204.70.1.197: it has many next hops. There are also a number of large networks behind this router, as seen by the clusters of nodes and links visible behind the fanout on the right side of the sphere.
NSFNET: Internet Atlas Gallery
NSFNET growth until 1995
Donna Cox and Robert PattersonThe National Center for Supercomputing Applications (NCSA),
National Science Foundation's Supercomputer Centers Program
University of Illinois at Urbana-Champaign
URL: http://www.ncsa.illinois.edu
NSFNET was a series of networks coordinated by NFS, created to serve research and education purposes. Based on ARPANET protocols, NFSNET served as the backbone of a growing internet up until April 1995. The role of the backbone has since been handed over to several commercial carriers, dissolving the notion of a single national Internet backbone.
Abilene Weather Map: Internet Atlas Gallery
Abilene Weather Map (using MRTG data)
Mark MeissIndiana University Network Operations Center
Indiana University, Bloomington, IN (IU)
URL: http://hydra.uits.iu.edu/~abilene/traffic/
| Visualization Thumbnail | Analysis | ||||
|---|---|---|---|---|---|

|
|
||||
| Click Image for Full-Size Visualization | Back to Gallery |
MBone: Internet Atlas Gallery
Mbone Tunnels of the Major Backbone Networks
Tamara MunznerStanford UniversityEric Hoffman Ipsilon Networks
kc claffy CAIDA at SDSC
Bill Fenner Xerox PARC
URL: http://www-graphics.stanford.edu/papers/mbone/
| Visualization Thumbnail | Analysis | ||||
|---|---|---|---|---|---|
 |
|
||||
| Full-Size Visualization | Back to Gallery |
Reverse traceroute: Internet Atlas Gallery
World-Wide Mapping of Reverse traceroute and looking glass Servers
Wilfred DittmerCooperative Association for Internet Data Analysis (CAIDA)
San Diego Supercomputer Center (SDSC)
University of California, San Diego (UCSD)
URL: https://www.caida.org/research/routing/reversetrace
| Visualization Thumbnail | Analysis | ||||
|---|---|---|---|---|---|

|
|
||||
| Click Image for Full-Size Visualization | Back to Gallery |
Layout Showing the Major ISPs: Internet Atlas Gallery
Layout Showing the Major ISPs
Bill Cheswick, Bell Labs and Hal Burch, CMULucent Technologies Bell Labs Innovations
Carnegie Mellon University (CMU) Computer Science Dept.
URL: https://www.bell-labs.com/about/history/#gref
Frequent traceroute-style path probes are used to build a tree showing the paths to most of the nets on the Internet. Once the layout is computed, the map can be colored to show geographical clues, network capacity, or IP addresses. In this example, color distinguishes different ISPs.
Internet Atlas Gallery
Core AS Internet
Cooperative Assocation for Data Analysis (CAIDA)San Diego Supercomputer Center (SDSC)
University of California, San Diego (UCSD)
URL: https://www.caida.org/projects/as-core/
This graph combines dimensions showing peering richness and geographic information, revealing the highly 'core-connected' nature of Autonomous Systems (ASes). Polar angles represent the longitude of the AS headquarters, enabling consideration of continental implications of AS richness.
| Visualization Thumbnail | Analysis | ||||
|---|---|---|---|---|---|
 |
|
||||
| Full-Size Visualization | Back to Gallery |
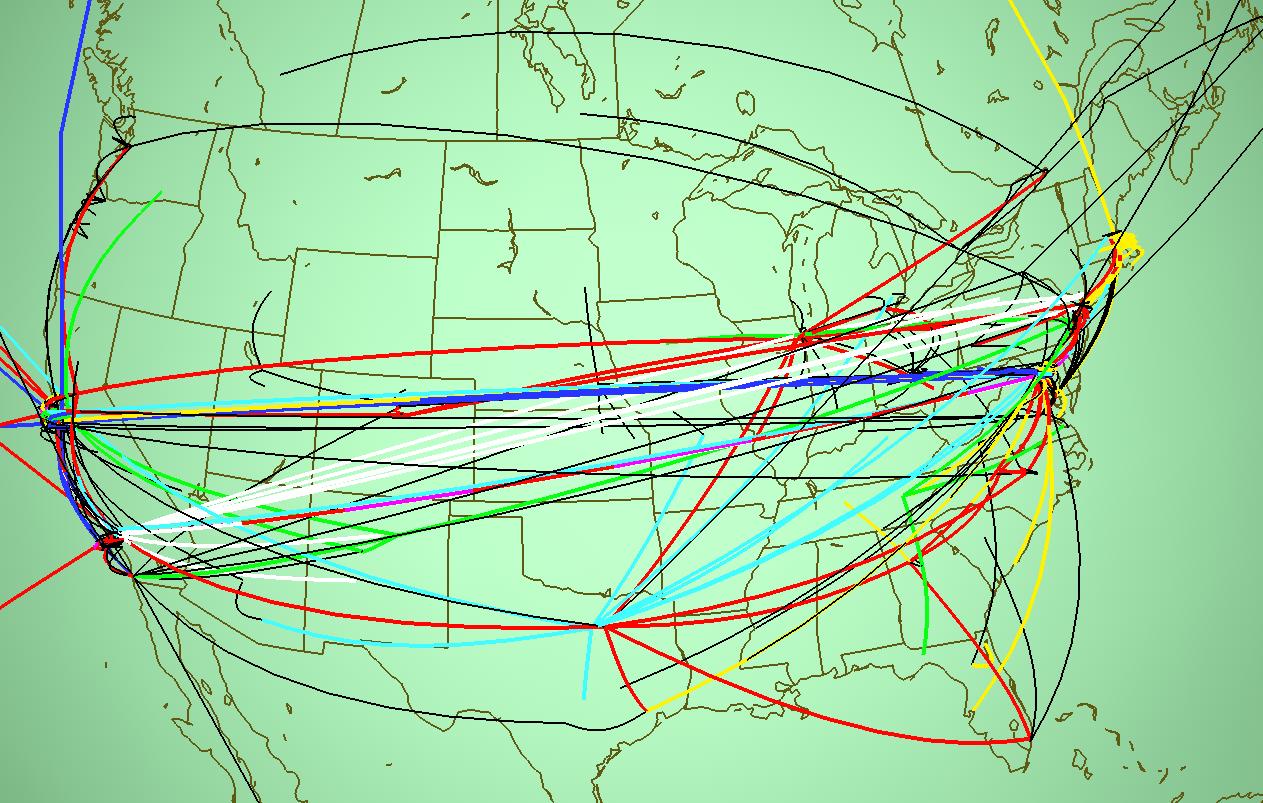
GTrace: Internet Atlas Gallery
GTrace - Geographical Traceroute
Ram PeriakarrupenCooperative Association for Internet Data Analysis (CAIDA)
San Diego Supercomputer Center (SDSC)
University of California, San Diego (UCSD)
URL: https://www.caida.org/catalog/software/gtrace/
GTrace is a graphical front end to traceroute that uses a number of heuristics to determine the location of each node along a network path.
| Visualization Thumbnail | Analysis | ||||
|---|---|---|---|---|---|

|
|
||||
| Click Image for Full-Size Visualization | Back to Gallery |