

The contents of this legacy page are no longer maintained nor supported, and are made available only for historical purposes.
MBone: Internet Atlas Gallery
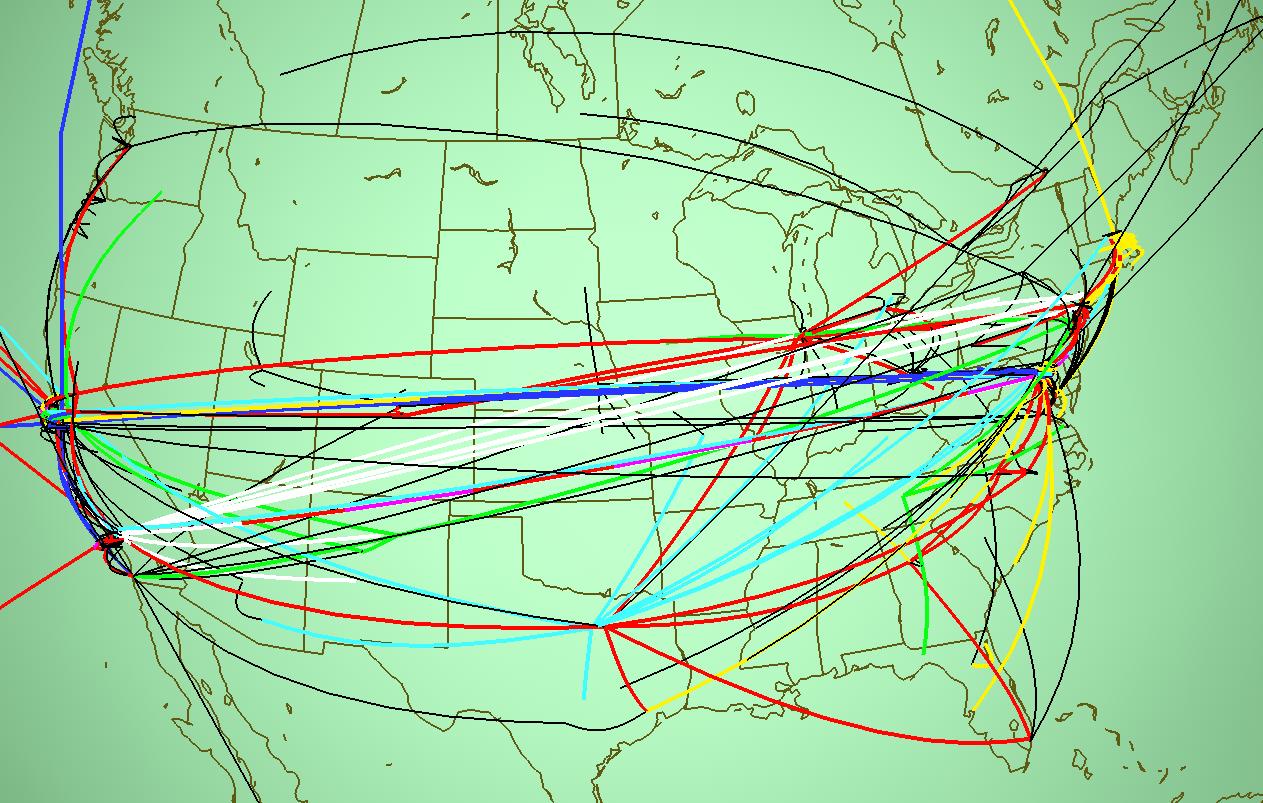
Mbone Tunnels of the Major Backbone Networks
Tamara MunznerStanford UniversityEric Hoffman Ipsilon Networks
kc claffy CAIDA at SDSC
Bill Fenner Xerox PARC
URL: http://www-graphics.stanford.edu/papers/mbone/
| Visualization Thumbnail | Analysis | ||||
|---|---|---|---|---|---|
 |
|
||||
| Full-Size Visualization | Back to Gallery |
Additional Content
Internet Atlas Gallery
Mbone Tunnels of the Major Backbone Networks
Tamara MunznerStanford UniversityEric Hoffman Ipsilon Networks
kc claffy CAIDA at SDSC
Bill Fenner Xerox PARC
URL: http://www-graphics.stanford.edu/papers/mbone/
| Visualization Thumbnail | Credits / Contact Info | ||
|---|---|---|---|
|
|
||
| Full-Size Visualization | Back |
Internet Atlas Gallery
Mbone Tunnels of the Major Backbone Networks
Tamara MunznerStanford UniversityEric Hoffman Ipsilon Networks
kc claffy CAIDA at SDSC
Bill Fenner Xerox PARC
URL: http://www-graphics.stanford.edu/papers/mbone/
| Visualization Thumbnail | About the Data | ||||
|---|---|---|---|---|---|
|
|
||||
| Full-Size Visualization | Back |
Internet Atlas Gallery
Mbone Tunnels of the Major Backbone Networks
Tamara MunznerStanford UniversityEric Hoffman Ipsilon Networks
kc claffy CAIDA at SDSC
Bill Fenner Xerox PARC
URL: http://www-graphics.stanford.edu/papers/mbone/
| Visualization Thumbnail | Evaluation | ||
|---|---|---|---|
 (Click image for full-size version.) |
| ||
| Full-Size Visualization | Back |
Internet Atlas Gallery
Mbone Tunnels of the Major Backbone Networks
Tamara MunznerStanford UniversityEric Hoffman Ipsilon Networks
kc claffy CAIDA at SDSC
Bill Fenner Xerox PARC
URL: http://www-graphics.stanford.edu/papers/mbone/
| Visualization Thumbnail | About the Visualization | |||
|---|---|---|---|---|
|
|
|||
| Full-Size Visualization | Back |