

The contents of this legacy page are no longer maintained nor supported, and are made available only for historical purposes.
GTrace: Internet Atlas Gallery
GTrace - Geographical Traceroute
Ram PeriakarrupenCooperative Association for Internet Data Analysis (CAIDA)
San Diego Supercomputer Center (SDSC)
University of California, San Diego (UCSD)
URL: https://www.caida.org/catalog/software/gtrace/
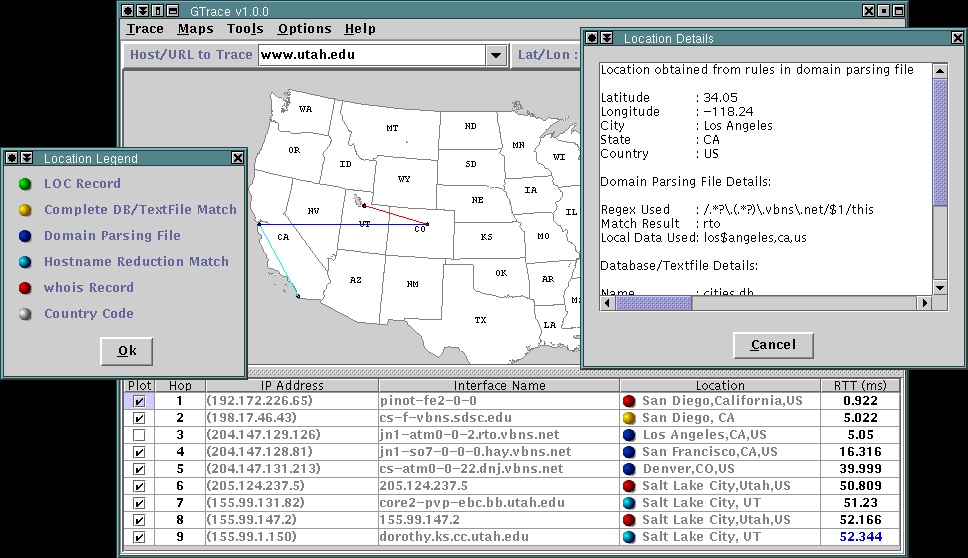
GTrace is a graphical front end to traceroute that uses a number of heuristics to determine the location of each node along a network path.
| Visualization Thumbnail | Analysis | ||||
|---|---|---|---|---|---|
|
|
||||
| Click Image for Full-Size Visualization | Back to Gallery |
Additional Content
Internet Atlas Gallery
GTrace - Geographical Traceroute
Ram PeriakarrupenCooperative Association for Internet Data Analysis (CAIDA)
San Diego Supercomputer Center (SDSC)
University of California, San Diego (UCSD)
URL: https://www.caida.org/catalog/software/gtrace/
| Visualization Thumbnail | Evaluation | ||
|---|---|---|---|

|
|
||
| Click Image for Full-Size Visualization | Back |
Internet Atlas Gallery
GTrace - Geographical Traceroute
Ram PeriakarrupenCooperative Association for Internet Data Analysis (CAIDA)
San Diego Supercomputer Center (SDSC)
University of California, San Diego (UCSD)
URL: https://www.caida.org/catalog/software/gtrace/
| Visualization Thumbnail | About the Visualization | |||
|---|---|---|---|---|
|
|
|
|||
| Click Image for Full-Size Visualization | Back |
Internet Atlas Gallery
GTrace - Geographical Traceroute
Ram PeriakarrupenCooperative Association for Internet Data Analysis (CAIDA)
San Diego Supercomputer Center (SDSC)
University of California, San Diego (UCSD)
URL: https://www.caida.org/catalog/software/gtrace/
| Visualization Thumbnail | Credits / Contact Info | ||
|---|---|---|---|
|
|
|
||
| Click Image for Full-Size Visualization | Back |
Internet Atlas Gallery
GTrace - Geographical Traceroute
Ram PeriakarrupenCooperative Association for Internet Data Analysis (CAIDA)
San Diego Supercomputer Center (SDSC)
University of California, San Diego (UCSD)
URL: https://www.caida.org/catalog/software/gtrace/
| Visualization Thumbnail | Data | ||||
|---|---|---|---|---|---|
|
|
|
||||
| Click Image for Full-Size Visualization | Back |
/projects/internetatlas/gallery/gtrace/snapshots/index/