The contents of this legacy page are no longer maintained nor supported, and are made available only for historical purposes.
Internet Atlas Gallery
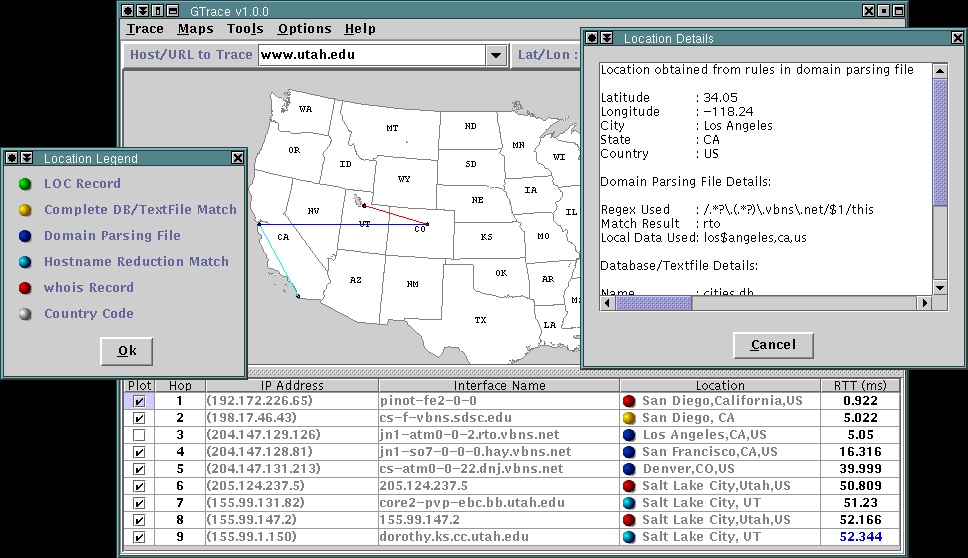
GTrace - Geographical Traceroute
Ram Periakarrupen
Cooperative Association for Internet Data Analysis (CAIDA)
San Diego Supercomputer Center (SDSC)
University of California, San Diego (UCSD)
URL: https://www.caida.org/catalog/software/gtrace/
| Visualization Thumbnail |
About the Visualization |
|
|
Visualization Techniques:
(Technique1):
Plot lat/long points; draw straight lines between hops.
|
Key Visualization Mappings:
(Mapping1):
Line color shows confidence in location mapping.
- Green line = high confidence in both endpoints
- Yellow line = high confidence in one endpoint; moderate confidence in
other
- Blue line = moderate confidence in both endpoints
- Red line = geographic center of the country where the
IP address is believed to be located, or the location
obtained from the whois record of the associated
domain name
(Mapping2):
Colored ball indicates the data source used
for the lat/long mapping
- Green = DNS LOC record
- Yellow = Match found in GTrace DBs or user DBs
- Blue = Domain parsing file
- Cyan = Hostname reduction match
- Red = WHOIS record of the best-match domain name for IP address
- Gray = Country code
(Mapping3):
Color of RTT value shows how many packets were lost:
- Black = none
- Blue = lost one pkt
- Red = lost 2 or 3 pkts
|
Visualization Tools:
(Tool1) traceroute
by Van Jacobsen
(Tool2) GTrace
java code by Ram Periakaruppen (CAIDA).
(Tool3) NetGeo utilities by CAIDA
|
|
| Click Image for Full-Size Visualization
|
Back |