
GeoPlot: Applet Parameters
GeoPlot is considered a deprecated tool and is not any longer supported by CAIDA. These pages are made available for historical purposes.
See the CAIDA Resource Catalog view for this page to explore related objects.
Parameter : mapname |
| Example: |
| <param name=mapname value="xyz.gif"> |
| <param name=mapname value="/maps/xyz.gif"> |
| <param name=mapname value="URL"> |
Parameter : bgcolor |
| Example: |
| <param name=bgcolor value="lightGray"> |
| <param name=bgcolor value="rgb-255-0-255"> |
Parameter : fgcolor |
| Example: |
| <param name=fgcolor value="red"> |
| <param name=fgcolor value="rgb-255-0-0"> |
Parameter : title |
| Example: |
| <param name=title value="xyz"> |
Parameter : date |
| Example: |
| <param name=date value="07/15/1999"> |
Parameter : default_node_size |
| Example: |
| <param name=default_node_size value=6> |
Parameter : default_line_size |
| Example: |
| <param name=default_line_size value=1> |
Parameter : default_node_color |
| Example: |
| <param name=default_node_color value="red"> |
Parameter : default_line_color |
| Example: |
| <param name=default_line_color value="green"> |
Parameter : default_font_size |
| Example: |
| <param name=default_font_size value=10> |
Parameter : refresh_interval |
| Example: |
| <param name=refresh_interval value=60> |
Parameter : hide_key |
| Example: |
| <param name=hide_key value="false"> |
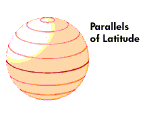
Parameter : top_lat |
| Example: |
 |
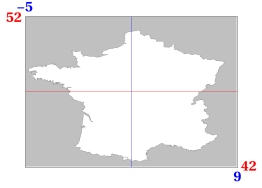 |
| <param name=top_lat value=52> |
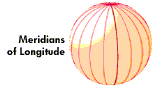
Parameter : top_lon |
| Example: |
 |
|
| <param name=top_lon value=-5> |
Parameter : bot_lat |
| Example: |
|
|
| <param name=bot_lat value=42> |
Parameter : bot_lon |
| Example: |
| |
|
| <param name=bot_lon value=9> |
Parameter : color_key |
Using the color_key parameter, it is possible to define a color key that can be used to determine the color of the lines drawn. Line definitions would have a color value that would get matched against this key to determine the color of the line. Such a color value takes precedence over a color defined for the line using the cl: parameter. The syntax for defining the key is shown below.
| x: | x-coordinate of the top-left hand corner of the key |
| y: | y-coordinate of the top-left hand corner of the key |
| w: | width of the key |
| h: | height of the key |
| t: | title of the key (Cannot have a comma in the title as of this release) |
| s: | font-size with which title should be displayed, the key labels are displayed at a font-size 3 less than the value specified here |
| Example: |
| <param name=color_key value= |
| "key,x:10,y:400,w:150,h:110,t:% of Bytes,s:13; |
| 0 && 0.01 : black : From USA; |
| 0.01 && 0.02 : rgb-255-0-0; |
| 0.02 && 0.03 : cyan; |
| 0.03 && 0.04 : gray; |
| 0.04 && 0.05 : darkgray; |
| 0.05 && 0.06 : magenta; |
| 0.06 && 0.07 : orange; |
| 0.07 && 0.08 : pink; |
| 0.08 && 0.09 : blue; |
| 0.09 && 0.1 : yellow; |
| 0.1 && 100 : green;"> |
Parameter : size_key |
Using the size_key parameter, it is possible to define a size key that can be used to determine the width of the lines drawn. Line definitions would have a size value that would get matched against this key to determine the width of the line. Such a size value takes precedence over a size defined for the line using the sz: parameter. The syntax for defining the key is shown below.
| x: | x-coordinate of the top-left hand corner of the key |
| y: | y-coordinate of the top-left hand corner of the key |
| w: | width of the key |
| h: | height of the key |
| t: | title of the key (Cannot have a comma in the title as of this release) |
| s: | font-size with which title should be displayed, the key labels are displayed at a font-size 3 less than the value specified here |
| Example: |
| <param name=size_key value= |
| "key,x:170,y:440,w:150,h:70,t:% of Bytes,s:13; |
| 5 : 22 : Telnet; |
| 11 && 20 : 12 : Rlogin; |
| 21 && 30 : 8 : SSH;"> |
Parameter : data |
NODES
Syntax :
| Field 1 | Field 2 | Field 3 | Field 4 | [Field 5] |
| n/N | key | latitude | longitude | Optional Description String |
| t: | title |
| sz: | diameter of node |
| vc: | color value that is matched against color key |
| vs: | size value that is matched against size key |
| cl: | color of node |
| u: | URL to open when clicked on |
| d: | description that is shown in status bar when mouse is over node |
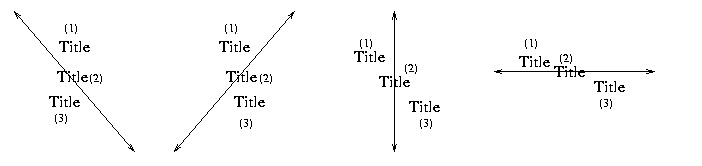
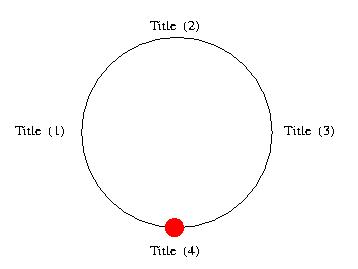
Placement of Title :
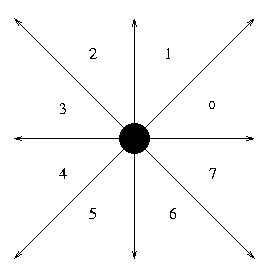
| 56 | title appears centered between quadrants 5 and 6 |
| 21 | title appears centered between quadrants 1 and 2 |
| 70 | title appears centered between quadrants 0 and 7 |
| 43 | title appears centered between quadrants 3 and 4 |
| 0 through 7 | title appears begining or ending in their respective quadrant |
| Example: |
| n CN 38.00 105.00 d:This was the 1st node definition; |
| n US 38.00 -98.00 t:USA,70 d:This was the 2nd node definition u:http://www.aciri.org; |
| n RO 46.00 25.00 d:This was the 3rd node definition; |
| n CA 60.00 -96.00 t:Canada cl:rgb-0-255-0 d:This was the 4th node definition; |
LINES
Syntax :
| Field 1 | Field 2 | Field 3 | [Field 4] |
| l/L | source key | destination key | Optional Description String |
| t: | title |
| sz: | width of line |
| vc: | color value that is matched against color key |
| vs: | size value that is matched against size key |
| cl: | color of line |
| u: | URL to open when clicked on |
| d: | description that is shown in status bar when mouse is over line |
| r: | direction of arrow |
Direction of Arrow :
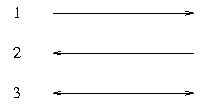
| 1 | arrow at destination end of line |
| 2 | arrow at source end of line |
| 3 | arrow on both ends |
| Example: |
| l US AU vc:0.15 vs:25 d:Fat pipe USA-AUS u:http://www.cnn.com; |
| l US AU vc:0.025; |
| l AU US; |
| l AU US vc:0.045; |
| l AU US cl:rgb-255-0-255; |
| l BR BR vc:0.015 vs:25; |
| l US BR vc:0.025 r:3 t:USA-BRAZIL,1; |
Colors |
| black | |
| red | |
| blue | |
| cyan | |
| darkGray | |
| gray | |
| green | |
| lightGray | |
| magenta | |
| orange | |
| pink | |
| white | |
| yellow |
| r | red component |
| g | green component |
| b | blue component |
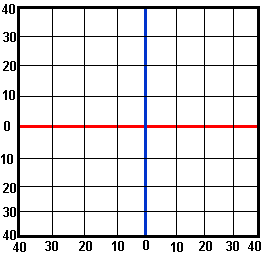
Using Latitude and Longitude |