

CAIDA's Annual Report for 2005
- are macroscopic in nature and provide enhanced insight into the function of Internet infrastructure worldwide
- provide access to analysis and visualization tools to facilitate network measurement and management
Executive Summary
The Cooperative Association for Internet Data Analysis (CAIDA) conducts independent analysis and research on the commodity Internet. Based at the University of California's San Diego Supercomputer Center, the group aims to promote greater cooperation in the engineering and maintenance of a robust, scalable global Internet infrastructure, CAIDA provides a neutral forum for discussion and cooperative technical endeavors in measurement, analysis, and tool development.
This 2005 annual report offers updates on CAIDA research initiatives, project progress and results, growth of data sets, tool development and new releases, publications, funding sources, and annual operating expenses. During this period, CAIDA continued its work in six primary program areas: 1) routing, addressing and topology, 2) Internet traffic characterization, 3) network security, 4) the Domain Name System (DNS), and 5) network performance.
Projects
DNS
Improving the Integrity of Domain Name System (DNS) Monitoring and Protection
Goals
The Domain Name System, which maps hostnames to assigned IP addresses, is a critical infrastructure service whose efficiency and robustness are crucial for the flawless operation of the Internet. Despite the essential nature of the DNS, long-term research and analysis in support of its performance, stability, and security is sparse. Our goal is to enable DNS research pertinent to the real Internet problems by supplying the research community with the best available, operationally relevant and methodologically sound, measurement data. In addition, the tools, models, and analysis methodologies developed in the course of this project contribute to ensuring the DNS vitality and integrity facing sustained growth of the Internet user population worldwide.
During the first year of the project CAIDA actively collaborated with the Internet Systems Consortium (ISC), a not-for-profit corporation internationally known for their long-term operational experience and leadership in DNS activities. ISC is a founding member of the DNS Operations, Analysis, and Research Center (OARC) that provides a trusted platform for bringing together key operators, implementers, and researchers so they can identify problems, test solutions, share information, and learn together.
Activities
Our main task for the first year of the project was to survey the current status of the Domain Name System (DNS) and identify the biggest problems in the DNS. In support of the measurement aspects of this goal, we developed a measurement software tool (DSC - DNS Statistics Collector) and made it available to researchers and operators wishing to monitor their name servers. We also deployed this monitoring tool at three root servers and investigated individual cases of DNS abuse and misuse.
At the end of Year 1, we conducted a large scale simultaneous DNS data collection for 48 hours at 37 worldwide locations. OARC hopes to make this data available to the research community sometime during 2006.
For public outreach we conducted the first DNS workshop. Participants were operators (OARC members) and invited international researchers studying the DNS. We also started an annotated bibliography that reviews DNS-related research publications for their operational implications.
Major Milestones
- DNS measurements
-
We developed the DNS Statistics Collector (dsc) software tool which is an application for collecting and analyzing statistics from busy DNS servers. A downloadable source package includes full documentation. The application may be run directly on a DNS node or on a standalone system configured to see bi-directional traffic for a DNS node. DSC captures many different statistics such as: query types, return codes, most-queried TLDs, popular names, IPv6 root abusers, query name lengths, reply lengths, and much more. These statistics can aid operators in tracking or analyzing a wide range of problems including: excessive queries, misconfigured systems, DNS software bugs, traffic count (packets/bytes), and possibly routing problems. DSC can store data indefinitely, providing long-term historical statistics related to DNS traffic. DSC also supports IP address anonymization and visualization of real-time or delayed data.
Currently the DSC is deployed and running on 7 nodes of c-root, 4 nodes of e-root, 5 nodes of f-root, and by some of the OARC members in their organizations. Real-time visualization of measured statistics is available to OARC members. Unfortunately, no DSC graphs are currently publicly available.
The task of making DSC collected data available to academic researchers turned into an unexpected challenge as existing contractual relationships did not specify the data Acceptable Use Policy (AUP) in sufficient detail. Now that we have realized the extent of the problem, CAIDA will make sure that all data collections for this project in year 2 are released using a legal framework based on that of the Department of Homeland Security (DHS) DHS PREDICT project.
- DNS abuse
-
We investigated a number of cases of DNS abuse and were able to track down and contact responsible parties. We are still discussing how to present a public list of DNS abusers on a regular basis and make it more widely known, i.e., to NANOG.
We surveyed the occurrences of DNS poisoning and reported our findings to ISC and other OARC members. There are privacy issues involved in making the DNS poisoning report public, we need to work these out before the Year 2 subcontract is signed.
We also isolated a bug in BIND 8.3.4 that under certain conditions cause large spikes of AAAA and A6 queries at the root servers.
Finally, we analyzed the properties and sources of spurious RFC1918 updates that are deflected from root servers to a specially created protective system of name servers known as AS112. (The so called RFC1918 or private addresses are intended strictly for use inside networks and should not leak to the outside world.) We found various flavors of Windows OSes to be responsible for 96-98% of these spurious updates. We informed the vendor about our findings and submitted an Internet draft to the IETF suggesting mitigating changes to the default configuration of full service resolvers. We will analyze the behavior of the most recent Windows versions in Year 2. We will also continue our community discussion regarding the most cost-effective ways to alleviate the RFC1918 updates problem.
- Hardening the DNS infrastructure
-
During the 1st year of the project eight anycast nodes were added to F-root: four in Europe (Munich, Prague, Barcelona, London), two in Asia (Chennai, Osaka), one in Africa (Nairobi) and one in the USA (Chicago). These new nodes improve the DNS service in regions with large user populations and increase the overall robustness of the worldwide DNS.
Special measurement boxes (Y-boxes) have been deployed at six anycast nodes of F-root (in Amsterdam, Munich, Palo Alto, San Francisco, Seoul, and Taipei). These boxes passively monitor all traffic coming to the actual DNS server, record the data to disk and asynchronously transmit them to an aggregation site at ISC.
We sampled a random 5% of the routed IPv4 address space in order to estimate the number of nameservers on the Internet and which software they are running. These results will provide the statistical baseline for models of DNS behavior and reaction to new algorithms.
- Scaling trust infrastructure
-
We developed web-based communication forum that enables secure communication among members with member-configurable access privileges. We also provided a secure jabber channel for trusted communications (ejabber). These new communication channels were opened for test use to OARC members.
We then conducted a survey of OARC members to identify their approaches and concerns regarding trust issues and to assess the utility of secure text-based channels. We summarized the answers to this survey and resulting insights into scaling trust in a technical report. We found that we underestimated the complexity of this task, which we learned is less amenable to a straightforward technical approach than we hoped. There are tremendous Human-Computer Interaction and even sociological and communication theory challenges. We will continue searching for more trust-enticing and cooperative approaches during the 2nd year of this project.
- Student Involvement
-
Hao Shang (a graduate student) examined replies received from randomly selected 376K unique domain name servers, analyzed their correctness, and identified several important types of misbehaviors.
Ritesh Kumar (a graduate student) looked at the behavior of various popular caching/recursing/forwarding nameserver software and end host resolvers. He ran laboratory tests simulating legitimate (or semi-legitimate) DNS traffic to assess robustness to denial-of-service attacks and other malicious probes.
- First DNS-OARC Workshop
-
In July 2005, CAIDA and ISC organized the First DNS-OARC workshop (https://www.caida.org/funding/dns-itr/) that brought together key operators of the global DNS and researchers analyzing and modeling DNS behavior . The workshop focused on the current status and future directions of DNS-related Internet measurements, security, and research and received high marks from all the participants. (See Workshops below.)
Security
PREDICT: Network Traffic Data Repository to Develop Secure IT Infrastructure
Goals
CAIDA played an active role in the development of a new program, the Protected Repository for the Defense of Infrastructure against Cyber Threats (PREDICT), designed to provide sensitive security datasets to qualified researchers, while preserving privacy and preventing data misuse.
Activities
CAIDA played an active role in the development of a new program to provide sensitive security datasets to qualified researchers, while preserving privacy and preventing data misuse. CAIDA's involvement in the effort, called the Protected Repository for the Defense of Infrastructure against Cyber Threats (PREDICT), includes assisting with: the technical framework to process applications for data; development of communications between Data Providers, Data Hosting Sites, and Researchers; collection and processing of data that will eventually be available through the program; developing and deploying infrastructure to allow CAIDA to serve datasets to researchers; and providing input for the development of a legal framework to support the project. In 2006, CAIDA hopes to participate in the launch of the PREDICT program as a data provider and a data hosting site, serving OC48 backbone peering link data, denial-of-service backscatter data, Internet worm data, Network Telescope data, and IP topology data to approved researchers.
Major Milestones
- Collected 16.6 TB of security data, 642 GB of Macroscopic Topology data, and 281 GB of OC48 peering link traces.
- Released the Backscatter-TOCS Data Set covering spoofed-source denial-of-service traffic between January 2001 and February 2004..
- Developed a local data tracking and indexing tool to maintain easily accessible information about trace availability and research-relevant configuration details.
- We improved data anonymization tools to allow more flexibility in handling various data types.
- Centralized data tracking and distribution for eventual use with PREDICT data requests.
- Purchased, installed, configured, and secured a new data server.
- Processed and inserted all existing OC48 and denial-of-service backscatter data in the PREDICT catalog.
Trusted Computing: Quantitative Network Security Analysis
Goals
Our work in quantitative security analysis attempts to move beyond anecdotal assessment of malicious events and accidental detection of compromised infrastructure. Because comprehensive security analysis is difficult, much work thus far on attack prevalence relies on surveys of impressions, rather than basic data collection. We aim to develop and apply novel techniques to rigorously describe the volume of spoofed-source denial-of-service attacks, random-scanning Internet worms, and opportunistic host scanning. We also collect data and conduct analyses over a period of years, rather than days, so as to get a comprehensive view of trends in malicious activity over time. Because this longitudinal data is a unique and valuable resource, we process collected data into datasets useful to those studying various security phenomena and distribute those datasets to researchers. We also worked to develop a real-time monitor of the UCSD Network Telescope that provides an up-to date view of traffic behavior.
Many, if not most, successful attacks to compromise computational infrastructure are discovered accidentally, rather than via established monitoring techniques. In some cases, technology to detect these attacks exists but is not utilized due to financial or labor constraints. However the ability to detect other types of attacks, including identifying compromised routers that are actively undermining the correct behavior of routing protocols and the detection of illicit use of a compromised user account, has remained elusive. We made significant progress in developing techniques to detect these types of attacks in time to minimize the resulting damage.
Major Milestones
- DDoS Longitudinal Study
-
We concluded and submitted for publication a longitudinal study of denial-of-service backscatter activity between January 2001 and November 2004. We identified number, duration and focus of distributed denial-of-service attacks, and quantified attack characteristics, including volume, frequency, duration, and protocol. We also assessed DDoS victims, including targeted services, locations, and attack impact. In total, we observed over 68,000 attacks directed at over 34,000 distinct victim IP addresses -- ranging from well-known e-commerce companies such as Amazon and Hotmail to small foreign ISPs and dial-up connections. We believe our technique is the first to provide quantitative estimates of Internet-wide denial-of-service activity and that this paper describes the most comprehensive public measurements of such activity to date.
- Data collection
-
During 2005, we continued automated data collection on the UCSD Network Telescope resulting in the collection of 16.6 TB of data on anomalous Internet traffic. This data collection is automatically spooled into long-term storage in the high performance storage system (HPSS) housed at the San Diego Supercomputer Center. In addition to archival for future research needs, we process the data as collected for monitoring studies and reports. We also keep the most recent data available on disk for rapid analysis of new security events.
- Dataset Preparation
-
Because our collections of Denial-of-Service attack and Internet worm data are unique and highly useful for research, we worked to develop datasets to assist others in studying these phenomena. We released the Backscatter-TOCS Dataset covering spoofed-source denial-of-service traffic between January 2001 and February 2004. We also developed and beta-tested a Witty Internet Worm dataset for release in early 2006.
- Real-time Monitor Software
Towards our goal of providing a real-time view of anomalous traffic reaching the UCSD Network Telescope, we designed and implemented new monitor software to process and store data, generate graphs, and display traffic reports based on such criteria as application, network and geographic source and destinations, and transport type. We also adapted our denial-of-service attack identification and classification methods to work in real-time so that we could display separate views of denial-of-service attacks and scanning activities.
- sshark Account Compromise Detection Tool
- Many recent attacks on businesses and major Supercomputer centers have involved illicit logins via compromised accounts. These attacks are often difficult to detect as the attacker utilizes proper user credentials. Identification of these attacks involves discerning unusual patterns in user behavior -- especially those of more than one user simultaneously. While all novel behaviors do not indicate an attack, they provide insight for security administrators to investigate further to ensure that resources remain protected. To this end, we developed the sshark tool to analyze ssh login patterns and graphically display unusual behavior for further investigation.
- Student Involvement
-
Masters student Bhavjit Walha is extending our previous work in detecting and classifying spoofed source denial of service attacks to operate in real-time.
REU student Lindsey Desalvo worked on sshark, an ssh log analysis tool, designed to find subtle intrusions through user behavior pattern analysis. Development of this tool was motivated by reports of intrusions, including many in the Spring and Summer of 2004 which involved modified ssh clients that collected and exported passwords of unsuspecting users.
Masters student Jay Chen developed a specialized gateway to sit in front of the network telescope to redirect probe to multiple traffic monitors and honeypot systems. We will use this gateway to implement filtering and protection policies for a honeyfarm of virtual machines responding to traffic from the UCSD Network Telescope.
Ph.D. student Alper Mizrak worked on developing techniques and protocols to detect routers which are behaving incorrectly or maliciously. Network routers occupy a key role in modern data transport and consequently are attractive targets for attackers. By manipulating, diverting or dropping packets arriving at a compromised router, an attacker can trivially mount denial-of-service, surveillance or man-in-the-middle attacks on end host systems. We specify the problem of detecting routers with incorrect packet forwarding behavior and we explore the design space of protocols that implement such a detector. We further present a concrete protocol that is inexpensive enough for practical implementation at the scale of currently deployed networks. We believe our work is an important step in being able to tolerate attacks on key network infrastructure components. Alper's work on Fatih [1], a system for detecting and isolating malicious routers, was recognized with the William C. Carter Award at DSN 2005.
1. A. T. Mizrak, Y.-C. Cheng, K. Marzullo, and S. Savage, "Fatih: Detecting and Isolating Malicious Routers," in The International Conference on Dependable Systems and Networks (DSN 2005), (Yokohama, Japan), The Internet Society, June 2005. https://cseweb.ucsd.edu/~savage/papers/DSN05.pdf. This paper has been recognized with the William C. Carter Award.
UCSD Network Telescope
Goals
The UCSD network telescope acts as a passive data collection system. The network telescope consists of a globally routed /8 network that carries almost no legitimate traffic. Because the legitimate traffic is easy to separate from the incoming packets, the network telescope provides us with a monitoring point for anomalous traffic that represents almost 1/256th of all IPv4 destination addresses on the Internet.
Because a network telescope (also known as a blackhole, an Internet sink, or a darknet) does not contain any real computers, there is no reason that legitimate traffic would be monitored by the network telescope. The network telescope collects traffic as a result of a wide range of events, including misconfiguration (e.g. a human being mis-typing an IP address), malicious scanning of address space by hackers looking for vulnerable targets, backscatter from random source denial-of-service attacks, and the automated spread of malicious software called Internet worms.
While researchers at CAIDA and in the network security community are still working to identify the sources of the misconfigurations and other human errors that send traffic into the network telescope, the utility of network telescopes for identifying denial-of-service attack victims and tracking the spread of Internet worms has been more thoroughly explored.
Please see the UCSD Network Telescope home page for details about the telescope, related information and data access.
Activities
The data collected by the UCSD Network Telescope has application in numerous network security related areas of research including Denial-of-Service attacks, Internet worms, and malicious network scans.
- Denial-of-Service Attacks
-
The UCSD network telescope can be used to monitor the spread of random-source distributed denial-of-service attacks. When an attacker wants to make it difficult for the attack victim (and the victim's ISP(s)) to block an incoming attack, the attacker uses a fake source IP address (similar to a fake return address in postal mail) in each packet sent to the victim. Because the attack victim can't distinguish between incoming requests from an attacker and legitimate inbound requests, the denial-of-service attack victim tries to respond to every request it receives. When the attacker spoofs a source address in the network telescope, we monitor a response destined for a computer that doesn't exist (and therefore never sent the initial query). By monitoring these unsolicited responses, researchers can identify denial-of-service attack victims and infer information about the volume of the attack, the bandwidth of the victim, the location of the victim, and the types of services the attacker targets.
- Internet Worms
-
Many Internet worms spread by randomly generating an IP address to be the target of an infection attempt and sending the worm off to that IP address in the hope that that address is in use by a vulnerable computer. Because the network telescope includes one out of every 256 IPv4 addresses, it receives approximately one out of every 256 probes from hosts infected with randomly scanning worms.
- Malicious Network Scans
-
Malicious network scans include automated, semi-automated, and manual attempts to locate exploitable computers on the Internet. Scans often differ from other types of traffic visible on the network telescope because the scan traffic arriving at the telescope is not driven by chance. Rather, the attacker's byzantine motives in selecting scan targets appear arbitrary from the perspective of the recipient of the scan. The UCSD Network Telescope receives many types of scans continually, including ping based scans for the existence of a device at a given IP address, sequential scans of ports on a single IP address, methodical scans for a single or a small number of vulnerable ports sequentially through an IP address range, and even scans utilizing TCP resets.
Major Milestones
- We configured and installed a new Network Telescope collection monitor to help process the ever-increasing volume of traffic. The new monitor allows us to perform additional, increasingly complex analyses on the data in real time.
- Collected, processed, and archived 16.6 TB of Network Telescope data.
- Released the Backscatter-TOCS Dataset covering spoofed-source denial-of-service traffic between January 2001 and February 2004.
- As detailed above, we developed new software to generate real-time reports of denial-of-service, worm, and scanning activities on the UCSD Network Telescope.
Internet Measurement Data Catalog
Correlating Heterogeneous Measurement Data to Achieve System-Level Analysis of Internet Traffic Trends
Goals
The primary goal of the Correlating Heterogeneous Measurement Data to Achieve System-Level Analysis of Internet Traffic Trends Project, is the creation and population of DatCat: the Internet Measurement Data Catalog (IMDC). Internet data remains one of the basic components of computer science network research. Despite its necessity, available data is limited by legal, social, and technical constraints on its collection and distribution. CAIDA has three goals for the creation of the IMDC database:
- provide a searchable index of Internet data available for research
- enhance documentation of datasets via a public annotation system
- advance network science by promoting reproducible research
In addition to our IMDC development efforts, We continue to collect and analyze diverse sets of Internet data to investigate the current characteristics and function of the Internet.
Activities
In 2005, the trends project entered its third year with continued effort on the Internet Measurement Data Catalog (IMDC). This catalog will archive meta-data for existing and future diverse Internet measurement data sets.
We have implemented the first phase of the Internet Measurement Data Catalog (IMDC) web service with a back-end, 15-table database running under an Oracle relational database management system. The front-end is a web server implemented with Java servlets. The web service will accept submission of metadata from contributors via upload of an XML file. We are currently om the process of developing metadata to describe four terabytes of CAIDA data.
Also during 2005, we continued to collect and distribute data from passive monitors and 22 active monitors. Nearly 200 requests for data have been answered, with more than 100 research groups accessing network data collected and served by CAIDA. We developed new report generation tools that produce easily configurable, comprehensive, real-time summaries of network traffic on monitored links. These reports were deployed on the CAIDA-operated UCSD Network Telescope.
CAIDA uses the available data to analyze and visualize continuing and emerging Internet traffic properties and trends.
Major Milestones
In its third year, the trends project reported the following major milestones.- Implementing the IMDC
-
- Redesigned Java servlets with Object Oriented design to maximize code reuse and consistency. Servlets are deployed in an Apache Tomcat servlet container using Java Database Connectivity.
- Redesigned HTML layout, including moving visual design elements into Cascading Style Sheets (CSS) for consistency and ease of change.
- Added Javascript features to enhance performance and usability of web interface while maintaining full functionality for browsers without Javascript.
- Implemented login system with passwords and other authentication information (HTTP cookies) always encrypted during transmission and storage.
- Added two search modes: a simple Google-like single-input form, and an advanced form that allows specification of a number of specific individual fields and comparison modes. Implemented search path to take user from Data, to Packages that contain that data, to Locations where the user can obtain those packages.
- Designed and implemented system of permanent identifiers for IMDC objects that are independent of the underlying implementation, so that published URLs can reference data objects virtually forever regardless of future changes in the implementation. Considered using Handle System for IMDC Object Identifiers, but decided instead to use a more human-friendly custom URI (Universal Resource Identifier) format.
- Designed an Extensible Markup Language (XML) format and corresponding Document Type Definition for user contribution of massive amounts of metadata, and implemented XML parser on top of Simple API for XML.
- Designed and implemented Perl API to help users generate XML contribution files. Added web forms to facilitate interactive error correction. XML contributions are validated and inserted into the database via back-end Java/JDBC code.
- Redesigned and implemented annotation system with namespaces and types, and defined a default set of common annotation keys. Upgraded Tomcat and added 'jsvc' wrapper to allow secure execution of web server on standard ports.
- Switched from DB2 to Oracle RDBMS to obtain better production level support with lower costs from SDSC.
- Cataloging CAIDA data sets into IMDC
-
- Developed specifications for annotations of CAIDA data sets.
- Developed and ran software designed to analyze CAIDA data in terms of general statistics (file size, number of files, counts of packets/bytes/flows, etc.) and generated corresponding IMDC annotations.
- Created XML files describing CAIDA data and used them as input to test Perl API for contributing data to IMDC.
- Releasing CAIDA data to the community
-
- Created a completely new data section on our web site describing all of our data, associated research problems and uses and practical information on data access. https://catalog.caida.org/search?query=types=dataset%20caida
- Prepared and released to a small group of beta-testers a new witty worm data package which is the first publicly available worm data set that we know of. This package is useful for studying the spread of the worm and is divided into two portions: a publicly available set of files containing summarized information that does not individually identify infected computers, and a set of files containing more sensitive information, including packet traces with complete IP and UDP headers.
- Redesigned and re-engineered our report generator that can monitor links and produce flexible reports on the traffic observed, covering such metrics as packet, byte, and flow volume, number of source and destination IP addresses and Autonomous Systems, the geographic regions exchanging traffic, and the types of applications used. In addition to adding geographic map views of traffic, the new software allows flexible display so that users can view a variety of graphs and tables displaying different time periods to get the most useful combination of specific snapshots in time and overviews of link activity.
- Data analysis
-
- We pioneered the area of remote physical device fingerprinting,
which is done without the fingerprinted device's known cooperation.
Our techniques based on clock skews report consistent measurements
when the measurer is thousands of miles, multiple hops, and tens of
milliseconds away from the fingerprinted device, and when the
fingerprinted device is connected to the Internet from different
locations and via different access technologies.
T. Kohno, A. Broido, and k. claffy, ``Remote physical device fingerprinting,'', in IEEE Symposium on Security and Privacy, Oakland, California, May 2005, IEEE Symposium on Security and Privacy.
https://catalog.caida.org/paper/2005_fingerprinting/ - We designed a specialized system that computes multiple
summaries of IP traffic in real time and automatically adapts the
parameters of the summarization algorithms. Our measurement system
is robust and continues to function when facing an anomalous
network behavior (worms, denial of service attacks) that can
overwhelm the memory or CPU resources in traditional systems.
K. Keys, D. Moore, and C. Estan, ``A Robust System for Accurate Real-time Summaries of Internet Traffic,'', in SIGMETRICS '05, Banff, Alberta, Canada, Jun 2005, ACM.
https://catalog.caida.org/paper/2005_flowest/ - We analyzed delays of traceroute probes for a full range of
probe sizes up to 9000 bytes as observed on unloaded high-end
routers. This study is the first to examine in a reliable testbed
setting the detailed statistics of ICMP response generation which
are the cornerstone of modern techniques for bandwidth estimation
and router fingerprinting.
A. Broido, Y. Hyun, and k. claffy, ``Spectroscopy of traceroute delays,'', in Passive and Active Network Measurement Workshop (PAM), Boston, Massachusetts, Mar 2005, PAM 2005
https://catalog.caida.org/paper/2006_pam-spectroscopy/ - We measured stream lifetimes for traffic on a backbone link in
California and a university link at Auckland. We observed frequent
occurrence of large bursts of small 'attack' streams which hinders
the integrity of traffic engineering approaches that "focus on the
elephants";.
N. Brownlee, ``Some Observations of Internet Stream Lifetimes,'', in Passive and Active Network Measurement Workshop (PAM), Boston, Massachusetts, Mar 2005, PAM 2005. https://catalog.caida.org/paper/2005_pam_streamlife/ - We studied the burstiness of TCP flows at the packet level and
developed a model explaining two different timescales in a TCP
flow. We verified our model by passive Internet measurement.
S. Shakkottai, N. Brownlee, and k. claffy, ``A Study of Burstiness in TCP Flows,'', in Passive and Active Network Measurement Workshop (PAM), Boston, Massachusetts, Mar 2005, PAM 2005.
https://catalog.caida.org/paper/2005_pam_tcpdynamics/ - We developed the Internet Measurement Data Catalog to
facilitate access to Internet data sets, allow annotation of data,
and provide a mechanism to allow network research results to be
reproduced.
- We pioneered the area of remote physical device fingerprinting,
which is done without the fingerprinted device's known cooperation.
Our techniques based on clock skews report consistent measurements
when the measurer is thousands of miles, multiple hops, and tens of
milliseconds away from the fingerprinted device, and when the
fingerprinted device is connected to the Internet from different
locations and via different access technologies.
- Student Involvement
-
Graduate student, Srinivas Shakkottai, co-wrote "The RTT Distribution of TCP Flows in the Internet and its Impact on TCP-based Flow Control", bibl. https://catalog.caida.org/paper/2004_tr_2004_02/, (2004). Technical report posted on CAIDA web site as well as "A Study of Burstiness in TCP Flows" , bibl. https://catalog.caida.org/paper/2005_pam_tcpdynamics/, (2005). PAM Published.
Routing
Toward Mathematical Rigorous Next-Generation Routing Protocols for Realistic Network Topologies
Goals
Our research applies key theoretical routing results in distributed computation to extremely practical purposes, i.e. fixing the Internet.
Our ambitious agenda is motivated by a set of several previous results, all spectacularly unexpected, which have revealed a huge gap in our fundamental understanding of data networks. Our agenda has three related and clearly defined tasks: 1) execute the next step on the path toward construction of practically acceptable next-generation routing protocols based on mathematically rigorous routing algorithms; 2) validate the applicability of the above algorithms against several sources of real Internet topology data; 3) build and evaluate a model for Internet topology evolution, which reflects fundamental laws of evolution of large-scale networks.
Activities
During the first year of the project we focused mostly on studies of the Internet topology. Since scalability characteristics of routing algorithms depend strongly on topological properties of underlying networks, it is logical to concentrate on topology analysis first.
We started to work on routing problems and attempted to construct non-equilibrium network models reflecting the Internet evolution. We also started a new task dealing with predictions of upcoming exhaustion of IPv4 and IPv6 address space and AS numbers. (See Internet Identifier Consumption)
Major Milestones
In 2005, the NeTS NR project focused on three main areas of research; topology, routing, and evolution.
- Topology Modeling
-
We report on topology analysis and modeling in the previous section of this annual report, however, we note here that routing scalability parameters depend strongly on characteristics of the underlying network topology. Not only network size, but also its structure, matters. One intuitively expects that routing on a `nice clean topology' is easier than on a random dynamic `mess'. Therefore, we care about realistic topologies, and since our concern is scalability, we must consider real, large-scale networks.
As mentioned above, to build our topologies, we made use of several data sources that contain information describing the connectivity between the various Autonomous Systems (AS) that make up the current Internet.
- Routing
-
We considered the roots of the scalability problems with current Internet interdomain routing and with all known proposals for future Internet interdomain routing. We demonstrated that according to the best available knowledge about Internet topology, a class of algorithms known as compact routing algorithms offers the best candidates for a potential solution. We also formulated the four most important problems concerning the potential applicability of compact routing to interdomain routing: the stretch scaling problem, the scale-free routing problem, the name-independent routing problem, and the dynamic routing problem.
Accordingly, we started to work on the stretch scaling problem and on the scale-free routing problem. Both tasks are currently in progress.
- Evolution
-
Our attempt to translate ISP business realities into an AS-level topology growth model failed. The model could hardly reproduce the observed node degree distribution (while the equilibrium dK-series approach reported in p.1 above easily reproduces all the characteristics of a given network topology). The reason for our growth model's failure appears to be related to the fundamental methodological problem with modeling complex systems: the set of abstractions used by the model was probably not adequate.
We also searched for an analytical solution for the best currently available non-equilibrium network growth model (Positive-Feedback Preference model by Zhou and Mondragon). Our preliminary results showed that the asymptotic behavior of this model is degenerate and the power laws it produces are pre-asymptotic finite-size effects which can be explained by the specifics of data-fitting techniques that the model utilizes. These findings might have interesting implications if we consider a possibility that power laws observed in many real-world complex networks are exclusively due to finite-size effects, while the asymptotic behavior of those networks is different.
- Student Involvement
-
The following graduate students participated in this project and were responsible for various research tasks accomplished:
X. Dimitropulos (Georgia Tech) developed new approaches to inferring AS business relationships and conducted an extensive survey of ISPs to verify his algorithms.
P. Mahadevan (UCSD) analyzed AS topologies derived from three different data sources and developed 2K-random graph generator.
R. Liu (UCLA) studied non-equilibrium AS-level topology models.
J. Lei Zan (UCI) considered existing compact routing schemes targeted at the stretch analysis. She build a simulation model and studied the stretch performance of this model on Internet-like topologies.
The NeTS NR project opens up a new area of research focused on applying key theoretical routing results in distributed computation to extremely practical purposes, i.e. fixing the Internet.
The success of our research agenda will promote evolution of existing networks through rigorous evaluation of their capability limits and will facilitate creation of next-generation networks.
Being elegantly generic in nature, our mathematically rigorous results are relevant to many types of networks, including overlay and programmable wireless and sensor networks.
This area of research constitutes a promising example of multi-disciplinary collaboration, cross-fertilizing networking, theoretical computer science, and physics. By increasing the flow of knowledge among these fields, our results have ramifications for research activities in all three of them.
Internet Identifier Consumption (IIC)
Research and analyses focusing on the consumption, concentration, and exhaustion of Internet identifiers
Goals
CAIDA hopes to inform future public policy by offering an objective analysis of questions revolving around IPv4 address exhaustion, allocations, concentration of address ownership, and IPv6 adoption. CAIDA conducted empirical analysis of the IPv4 and IPv6 addressing system to better understand the consumption of Internet address space over time. We hope to foster discussion of scenarios that juxtapose 1) the reality that the current Internet has become critical infrastructure for governments, organizations, and individuals throughout the world, 2) the Internet (on any timeline) requires an upgrade to a more scalable and sustainable addressing solution 3) the fact that any such solution requires an infusion of capital and skilled labor, and 4) the major organizations currently associated with ownership, maintenance, and upgrade of central core Internet infrastructure do not currently enjoy resources that would allow for such investments in the required upgrades.
Major Milestones
- kc claffy presented "apocalypse then": ipv4 address space depletion at the XVI meeting of American Registry for Internet Numbers (ARIN) in October 2005.
- IPv4 Address Space Concentration
-
CAIDA looked at IPv4 address space concentration to study what drives the demand for IPv4 address space. Do new players (organizations that have only received 1 total allocation) or old players (organizations that have received multiple allocations over time) push the growing demand and consumption of IPv4 address space?
In summary, we find a definite trend in address allocations toward increasing concentration of address space in old players. There is at least an order of magnitude more new players than old players, but old players hold more than half of the address space. We also find that most organizations have relatively few allocations. In particular, fewer than 500 organizations have 8 or more allocations, and the number of organizations with fewer than 8 allocations is at least 2 orders of magnitude greater than 500. In answer to our narrower question, we can say that old players make use of most of the address space, and we naively interpret this to mean that expansion of existing networks, rather than emergence of new networks, drives demand for IPv4 space. For the complete analysis, see IPv4 Address Space Concentration on the CAIDA web site at https://www.caida.org/archive/id-consumption/ipv4/.
Topology
CAIDA's topology research has three focus areas: macroscopic topology measurement, analysis of the observable ISP hierarchy, and topology modeling in support of routing.
Macroscopic Topology Measurements
Goals
CAIDA's most well-known topology project, our Macroscopic Topology Measurements project, actively probes IP paths from multiple sources to a large set (hundreds of thousands) of destinations across the current IPv4 address space. The gathered data allows both topological and geographical representations of a significant fraction of Internet connectivity. CAIDA makes this raw topology data, as well as daily summaries, available to the research community.
The gathered data:
- characterize macroscopic connectivity and performance of the Internet,
- allow various topological and geographical representations at multiple levels of aggregation granularity, and
- provide a valuable input for empirically-based modeling of the Internet behavior and properties.
Major Milestones
- Development of scamper
-
Like its predecessor skitter, scamper actively probes the Internet to analyze topology and performance. Unlike skitter, scamper supports both IPv6 and IPv4 path probing and can discover the maximum transmission unit (MTU) of a given path. Eventual deployment of scamper monitors will extend CAIDA's Macroscopic Topology Project to cover the growing IPv6 topology.
The scamper tool collects IP topology and latencies for both IPv4 and IPv6 address space. The gathered data will:
- characterize macroscopic connectivity and performance of the Internet,
- identify low frequency persistent routing changes,
- provide input for building the directed graph from a source to a wide sample of the Internet, and
- track the growth and progress of IPv6 deployment worldwide
- scamper Project Status
- The WIDE project funded Matthew Luckie
from the University of
Waikato to further develop scamper and release the source code.
Users can acquire the scamper source code on the web at http://www.wand.net.nz/scamper/
![[img]](/projects/as-core/pics-ipv6/ascore.center.200505-300x236.png)
IPv6 AS core poster
(Click to go to Visualizing IPv6 AS-level Internet Topology)Scamper was used to collect data for the IPv6 AS core poster above. You can find the poster, and the details on how we collected the data, on our web site at https://www.caida.org/projects/as-core/2008/ipv6.
For complete details on the scamper project, please refer to he web site at https://www.caida.org/catalog/software/scamper/.
Topology Analysis: AS Rank
Analysis of the the Internet Service Provider (ISP) hierarchy is critical to a deeper understanding of technical, economic and regulatory aspects of the Internet inter-domain routing system. As part of our research agenda to measure and analyze macroscopic Internet structure, we have developed a new procedure to rank Autonomous Systems (AS Rank) by their location in the Internet hierarchy. Our ranking relies upon AS relationship information that we discover using our new inference algorithms which we will describe here. Our algorithm is rooted in economic AS relationships, ranking each AS as a function of the number of IP prefixes advertised by this AS, its customer ASes, their customers' ASes, and so on.
Goals
The AS Rank Project provides ISP ranking based on business relationships between ASes.
Accurate knowledge of AS business relationships is relevant to both technical and economic aspects of the Internet's inter-domain structure. First, AS relationships determine routing policies that introduce a non-trivial set of constraints to paths over which Internet traffic can flow, with implications for network robustness, traffic engineering, macroscopic topology measurement strategies, and other research and operational considerations. Second, macroscopic analysis of AS relationships not only yields insight into the economic underpinnings of business realities in the current Internet, but also provides a solid validation framework for economy-based modeling of Internet topology evolution. Indeed, the Internet AS-level topology and its evolutionary dynamics are consequences of business decisions that Internet players make. Therefore, the ability to infer AS relationships is a promising tool for use in understanding and modeling the economic forces that drive the evolution of the Internet topology and its hierarchy.
Activities
The AS Rank project concentrated its efforts on analysis of the complexities of business relationships between ISPs. The system uses inferred customer-provider relationships to rank the ISPs. This activity involved the following 5-step methodology to implement the ranking system.
- Built an AS-level graph of the Internet from publicly available BGP table data.
- Found sibling to sibling (s2s) links by checking WHOIS records to find ASes that belong to the same company.
- Used the [DKH1] heuristics to determine the customer-provider direction for all remaining links in the graph.
- Defined the customer cone of an AS A as the AS A itself plus all the ASes that can be reached from A following only provider to customer (c2p) not customer to provider (c2p) and sibling to sibling (s2s) links. In other words, AS A's customer cone is A, plus A's customers, plus its customers' customers, and so on.
- Actively rank ASes by the following three customer cone size metrics: the number of ASes in the cone, the number of unique prefixes advertised by these ASes, and by the number of /24 blocks in the union of these prefixes.
Major Milestones
- CAIDA published https://catalog.caida.org/paper/2005_asrelationships/ that generalizes the problem of AS relationship inference as a multiobjective optimization problem with node-degree-based corrections to the original objective function of minimizing the number of invalid paths. The paper solves the generalized version of the problem using the semidefinite programming relaxation of the MAX2SAT problem. Keeping the number of invalid paths small, we obtain a more veracious solution than that yielded by recent heuristics.
- See the AS Ranking home page to interact with the ranking CGI script and for more project information and details.
Topology Modeling in Support of Routing
Goals
Topology modeling describes network link infrastructure at a variety of layers. CAIDA has active topology modeling efforts in numerous domains including active measurement, geopolitical, graph theory, policy related studies, and topology comparisons.
Activities
Statistical analysis
During 2005, we focused our efforts in this area on three goals: provide the Internet topology data to the community, analyze the statistical properties of Internet topologies extracted from these data sources, and then construct equilibrium network models (equilibrium models produce static, non-growing networks) reproducing the found statistical properties of Internet topologies. The ultimate goal is to use these models for theoretical and empirical performance analysis of new routing algorithms and protocols.
Major Milestones
- We began posting on our public web site the adjacency matrix of the Internet AS-level graph computed daily from observed skitter measurements. We also released to the community the adjacency matrix of the Internet router-level graph computed from the ITDK0304 skitter data collected between Apr 21 and May 8, 2003. The AS-level topology graphs extracted from continuous traceroute (skitter) measurements are available from https://catalog.caida.org/dataset/skitter_aslinks. The data gets aggregated and updated on a daily basis. We have data available for almost every day starting 01/02/2000.
- We made an anonymized router-level topology graph extracted from skitter measurements in April and May of 2003 available from https://www.caida.org/catalog/datasets/router-adjacencies/.
- We made the AS-level topologies extracted from skitter, BGP, and WHOIS data in March and April of 2004, the statistical comparison of these topologies, plots of a number of topology characteristics and associated datasets available from /catalog/papers/2005_tr_2005_02/supplemental/. Our analysis found that BGP updates offer more topological information than BGP tables.
- Associated with the previous milestone, CAIDA published
"Lessons from Three Views of the Internet Topology" that finds that
the joint node degree distributions (degree correlations) define
many other statistical characteristics of a network topology.
P. Mahadevan, D. Krioukov, M. Fomenkov, B. Huffaker, X. Dimitropoulos, k. claffy, and A. Vahdat, ``Lessons from Three Views of the Internet Topology: Technical Report,'', Tech. rep., Cooperative Association for Internet Data Analysis (CAIDA), Jun 2005.
https://catalog.caida.org/paper/2005_tr_2005_02/ - The observations from the "Lessons from Three Views of the Internet Topology" paper in the previous milestone lead us to the introduction of the concept of dK-series: 1) dK-distributions (generalizing the average degree (d=0), the node degree distribution (d=1), the degree correlations (d=2), etc.); 2) dK-graphs (sets of graphs with the same dK-distribution); and 3) dK-random graphs (generalizing the classical (Erdos-Renyi) random graphs (d=0), the random graphs with prescribed degree sequences, e.g., PLRG (d=1), etc.). For a high-level picture, see https://www.caida.org/workshops/wide/0503/slides/krioukov.pdf.
- The paper "Revisiting Internet AS-level Topology Discovery"
analyzes BGP updates and the AS-level topologies one can extract
from them. The paper finds that BGP updates have more topological
information than BGP tables. X. Dimitropoulos, D. Krioukov, and G.
Riley, ``Revisiting Internet AS-level Topology Discovery,'', in
Passive and Active Network Measurement Workshop (PAM), Boston,
Massachusetts, Mar 2005, PAM 2005.
https://catalog.caida.org/paper/2005_pam_topology/
Tools
CAIDA's mission includes providing access to tools for Internet data collection, analysis and visualization to facilitate network measurement and management. However, CAIDA does not receive specific funding for support and maintenance of the tools we develop. Please check our home page for a complete listing and taxonomy of CAIDA tools.
During 2005, CAIDA celebrated new versions of two packages developed by CAIDA staff, CoralReef and Walrus, as well as the preparation of a new package to be released early in 2006, Cuttlefish.
CoralReef
CAIDA released CoralReef version 3.7.4 on April 18, 2005. The CoralReef suite, developed by CAIDA, provides a comprehensive software solution for data collect and analysis from passive Internet traffic monitors, in real time or from trace files. Real-time monitoring support includes system network interfaces (via libpcap), FreeBSD drivers for a number network capture cards, including the popular Endace DAG (OC3 and OC12, POS and ATM) cards. The package also includes programming APIs for C and perl, and applications for capture, analysis, and web report generation. This package is maintained by CAIDA developers with the support and collaboration of the Internet measurement community.
Version 3.7.4 includes the crl_stats application for generating basic information about packet traces, IP address anonymization with CryptoPAN, improved error checking for gzip errors, and several bug fixes. See the CoralReef home page for more information or to download the package.
Walrus
CAIDA released Walrus version 0.6.3, the first version available under the GNU GPL, on June 21, 2005. Walrus is a tool for interactively visualizing large directed graphs in three-dimensional space. By employing a fisheye-like distortion, it provides a display that simultaneously shows local detail and the global context.
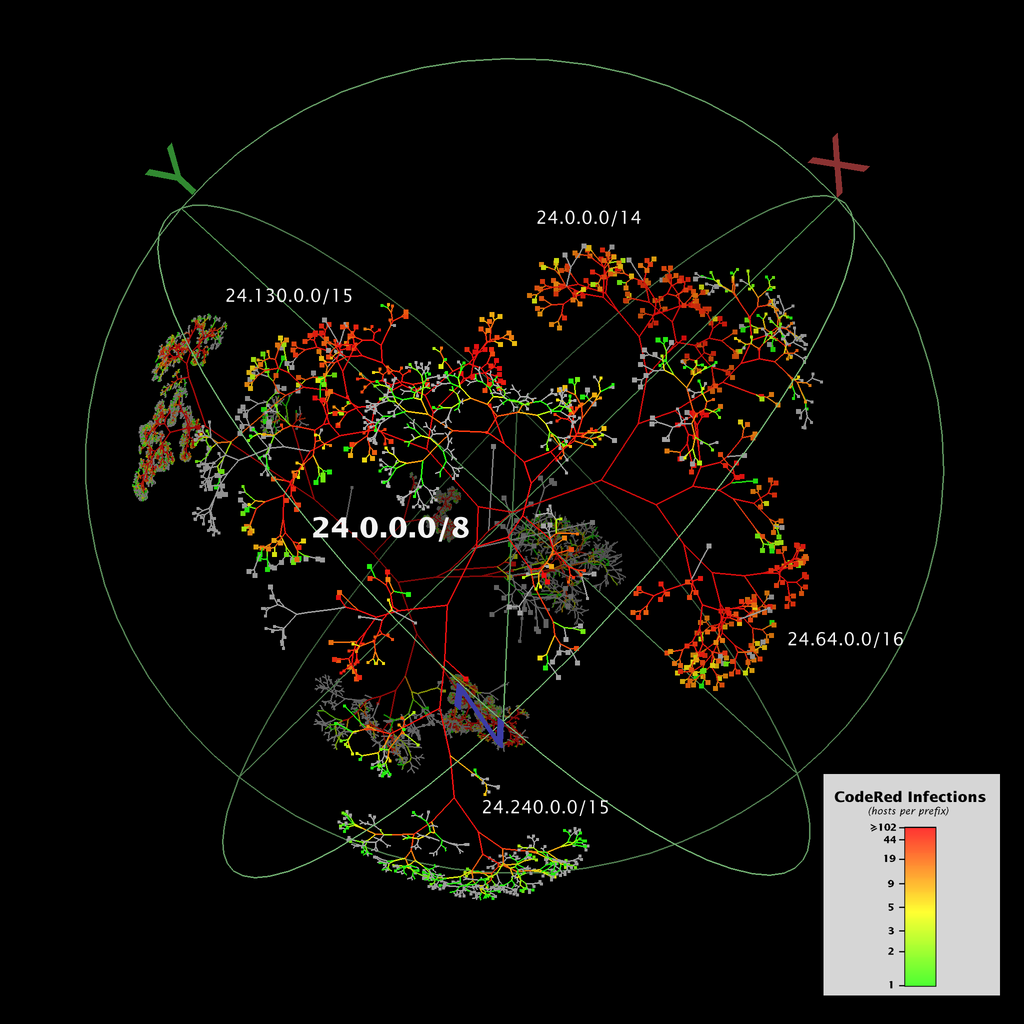
| This visualization of Code-Red Worm Infections (321,986 nodes and 321,985 links) was produced by Walrus. Please refer to this article for a full description of the CodeRed Infection. See the Walrus home page for more information or to download the software. |
|
Cuttlefish
Cuttlefish produces animated GIFs that reveal the interplay between the diurnal and geographical patterns of displayed data. By showing how the Sun's shadow covers the world map, cuttlefish yields a direct feeling for the time of day at a given geographic region, while moving graphs illustrate the relationship between local time and the visualized events. Cuttlefish will be released in early 2006.
CAIDA acknowledges WIDE for their generous support of cuttlefish development.
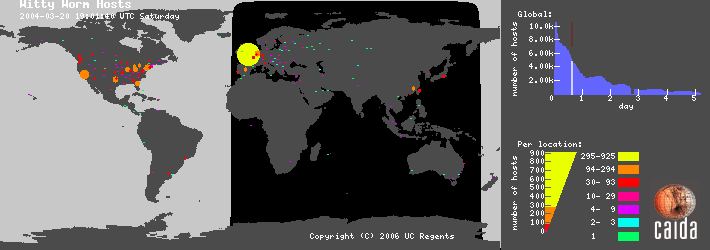 |
This visualization of hosts infected with the Witty Internet Worm was produced by Cuttlefish. Please refer to the Cuttlefish home page for more information about this visualization. |
| (Click the image for a larger version.) | |
See the Cuttlefish home page for more information, Cuttlefish examples or to download the software.
sshark
CAIDA began development of the sshark ssh log analysis tool. sshark is designed to find subtle intrusions, such as those perpetrated using compromised user passwords, by identifying anomalies in patterns of user behavior. sshark's public release is planned for 2006.
CAIDA Tools Download Report
The table below displays all the CAIDA developed tools distributed via our home page at https://catalog.caida.org/software and the number of downloads of each version during 2005.
-
Currently Supported Tools
Tool Description and Download Statistics coralreef A comprehensive software suite developed by CAIDA to collect and analyze data from passive Internet traffic monitors, in real time or from trace files. Version(s) Downloads Unique IP Addresses coral-3.7.4-public.tar.gz 1,026 544 coral-3.7.3-public.tar.gz 515 264 Paper: The Architecture of Coral Reef 157 170 Total 1,541 808 dsc A system for collecting and exploring statistics from busy DNS servers. Version(s) Downloads Unique IP Addresses all versions 487 285 dnsstat An application that watches DNS queries on UDP port 53 to collect accurate statistics on a specific nameserver. Version(s) Downloads Unique IP Addresses dnsstat-3.5.0.tar.gz 251 194 dnsstat-3.5.1a.tar.gz 317 196 Total 568 391 dnstop is a libpcap application (ala tcpdump) that displays various tables of DNS traffic on your network. Version(s) Downloads Unique IP Addresses all versions 4,606 2,746 sk_analysis_dump A tool that converts the ARTS++ binary file format to text for analysis of traceroute-like topology data. Version(s) Downloads Unique IP Addresses sk_analysis_dump-2.0.5.tar.gz 104 67 sk_analysis_dump-2.0.4.tar.gz 89 60 sk_analysis_dump-2.0.3.tar.gz 57 31 sk_analysis_dump-2.0.1.tar.gz 56 30 sk_analysis_dump-1.1.1.tar.gz 75 46 Total 383 235 walrus A tool for interactively visualizing large directed graphs in three-dimensional space. Version(s) Downloads Unique IP Addresses walrus-0.6.3.zip 2,595 1,790 walrus-0.6.3.tar.gz 1,201 837 walrus-0.6.3-src.zip 965 594 walrus-0.6.3-src.tar.gz 581 385 walrus-0.6.2.zip 97 95 walrus-0.6.2.tar.gz 41 34 Total 5,480 3,752 libsea A file format and a Java library for representing large directed graphs on disk and in memory. Version(s) Downloads Unique IP Addresses libsea-0.1-src.zip 457 280 libsea-0.1-src.tar.gz 400 209 Chart::Graph A Perl module that provides a programmatic interface to several popular graphing packages, including GNUPlot, XMGrace, and XRT. Version(s) Downloads Unique IP Addresses Chart-Graph-2.0.tar.gz 423 268 plot-latlong A tool for plotting points on geographic maps given a list of latitude/longitude pairs. Version(s) Downloads Unique IP Addresses plot-latlong-0.3.tar.gz 159 102 -
Past Tools
Tool Description and Download Statistics Mapnet A tool for visualizing the infrastructure of multiple international backbone providers simultaneously. Version(s) Downloads Unique IP Addresses MapNet Backbones web application 35,787 19,078 GeoPlot A light-weight java applet which allows users to create a geographical image of a data set. Version(s) Downloads Unique IP Addresses GeoPlot.jar 11,554 2,954 GeoPlot-1.0.0.tar.gz 767 512 GTrace A graphical front-end to traceroute. Version(s) Downloads Unique IP Addresses Paper: GTrace -- A Graphical Traceroute Tool 126 71 GTrace-v1.0.0Beta.tar.gz 3,429 2,233 otter A historical CAIDA tool used for visualizing arbitrary network data that can be expressed as a set of nodes, links or paths. Version(s) Downloads Unique IP Addresses otter web application 4,042 2,822 plotpaths An application that displays forward and reverse network path data from a single source to one or more destinations. Version(s) Downloads Unique IP Addresses plotpaths.tar.gz 283 171 plankton A tool for visualizing NLANR's Web Cache Hierarchy Version(s) Downloads Unique IP Addresses Paper: Visualization of the Growth and Topology
of the NLANR Caching Hierarchy236 plankton.tar 238 16
Data
In 2005, CAIDA continued its data collection activities with the addition of new OC48 peering link traces and continued collection of Macroscopic Topology and UCSD Network Telescope data. We also developed several additional datasets derived from data we collected and processed to increase its utility to researchers. These datasets include our AS Rank, AS adjacencies, and Router adjacencies datasets that were all publicly available in 2005, as well as several Backscatter and Worm datasets that will become available in early 2006. While some CAIDA data is available to anyone without restriction, CAIDA makes a subset of its collected data available to academic researchers and CAIDA members, with data access subject to Acceptable Use Policies (AUP) designed to protect the privacy of monitored communications, ensure security of network infrastructure, and comply with the terms of our agreements with data providers.
Major Milestones
- We developed new data collection tools generating highly accurate traffic summaries for high speed (OC48, 10GigE, OC192) links in real-time.
- We created a new database for centralized data tracking, recording information including pertinent details of hardware and software configuration during data collection, dataset purpose and uses, sensitivity and privacy details, anonymization, and distribution.
- We purchased, installed, configured, and secured a new data server for passive datasets. We reconfigured our data distribution to allow access to one or many datasets via a single password, and we migrated previously distributed datasets and access accounts to the new data server.
- We developed a new section for CAIDA's web site to provide comprehensive information about our Internet Data.
The tables below present statistics on how the CAIDA data collections grew during 2005. For a current view of data managed by CAIDA, beyond our passive trace, active, and security data collections, please refer to the Statistics on Collected Data: Data by the Numbers report. While the majority of CAIDA's datasets are represented on that page, those numbers represent a lower bound on the total data housed at CAIDA.
Data Collected in 2005
In 2005, CAIDA continued its data collection activities, adding over 17 terabytes of new data and bringing the total holdings to over 36 terabytes of uncompressed data. While much of this data remains in archive storage, the deployment of a new 20 TB SAN server allows recent data collections, as well as historic data relevant to current research efforts, to be easily accessible by CAIDA staff and remote data users alike.
Data Type File count First date Last date Total size (compressed) Total size (uncompressed) OC48 Peering Link Traces 104 2005-01-01 2005-01-22* 159.9 GB 281.7 GB Macroscopic Topology Measurements 10433 2005-01-01 2005-12-31 189.7 GB 642 GB Network Telescope 15408 2005-01-01 2005-12-31 6.242 TB 16.59 TB * - The brief period reflects the difficulty involved in deploying and maintaining network monitors as backbone links are upgraded to speeds for which there are either no available network monitor cards or the cards are prohibitively expensive.
Data Distributed in 2005
During 2005, users downloaded in excess of 6.5 terabytes of data from CAIDA data servers.CAIDA also developed and deployed a new data server that centralized the distribution of the OC48 and Backscatter data sets. CAIDA also developed a Witty Worm data set and released it to a few beta testers. We anticipate a public release of several worm data sets in the first half of 2006.
Restricted Access Data
These datasets require that users:
- be academic researchers or join CAIDA
- request an account and provide a brief description of their intended use of the data
- agree to an Acceptable Use Policy
Data Set Unique visitors Number of Visits Pages Accessed Hits Data Downloaded Raw Topology Traces* 387 1895 19,915,122 19,915,122 5.59 TB Anonymized OC48 Peering Link Traces 218 873 4548 4928 842.5 GB 2003 Internet Topology Data Kit 130 236 4468 4468 19.5 GB Backscatter Datasets** 77 184 649 760 53.1 GB * - Some users of the Skitter data regularly re-download the whole dataset, which increases the volume of data transferred but not additional use of the dataset.
** - CAIDA's original Backscatter Dataset (covering January 2001) was available from February 2003 through November 9, 2005. After November 9, 2005, the Backscatter-TOCS dataset (covering January 2001 - February 2004) became available. The "Backscatter Datasets" information above includes both datasets. The data in the original Backscatter Dataset is also contained in the Backscatter-TOCS dataset, so the original Backscatter Dataset is no longer available separately.
Publicly Available Data
These datasets require that users agree to an Acceptable Use Policy, but are otherwise freely available.
Data Set Unique visitors Number of Visits Pages Accessed Hits Data Downloaded AS Rank 4457 7953 15,909 19,842 870.25 MB AS Adjacencies 3872 10,550 41,568 41,568 1.2 GB Router Adjacencies 293 302 471 471 700.69 MB
Workshops
As part of our mission to investigate both practical and theoretical aspects of the Internet, CAIDA staff actively attend, contribute to, and host workshops relevant to research and better understanding of Internet infrastructure, trends, topology, routing, and security. Last year, CAIDA hosted the Fifth CAIDA/WIDE Workshop as well as the Workshop on Community Oriented Network Measurement Infrastructure.
Please check our web site for a complete listing of past and upcoming CAIDA Workshops.
Fifth CAIDA-WIDE Workshop
CAIDA hosted the fifth CAIDA/WIDE Workshop held on March 11-12, 2005 (by invitation only) in Marina del Rey, CA. The Workshop covered three main areas: DNS, IPv6, and BGP, as well as miscellaneous research and technical topics of mutual interest for CAIDA and WIDE participants. WIDE is a consortium of Japanese research organizations and companies working to establish a Widely Integrated Distributed Environment. WIDE researchers have collaborated with CAIDA since 1998. Currently, WIDE sponsors CAIDA research activities in IPv6/IPv4 topology and DNS studies.
Workshop on Community Oriented Network Measurement Infrastructure
The Workshop on Community Oriented Network Measurement Infrastructure (CONMI) was held on March 30, 2005 in Boston, Massachusetts from 9am-5pm, one day before the Passive and Active Measurement (PAM 2005) Workshop. The NSF-sponsored workshop was hosted by Mark Crovella and was jointly organized by Mark Crovella ( Boston University), Joerg Micheel (NLANR), and k claffy (CAIDA). Attendance at the workshop was by invitation-only. The CONMI workshop hosted a discussion regarding the viability and utility of a community-oriented network measurement infrastructure. The workshop brought together key members of the Internet measurement research community to discuss whether a community-oriented approach could address current and near-future challenges in large scale measurement and whether this cooperative model would benefit the Internet measurement community. The workshop concluded that development of a community-based active measurement system seemed currently feasible. Please refer to Community-Oriented Network Measurement Infrastructure (CONMI) Workshop Report for the full report.
First DNS-OARC Workshop
The first DNS-OARC Workshop was held on July 25-26, 2005 (by invitation only) in Santa Clara, CA. The focus of this Workshop was on the current status and future directions of DNS-related Internet measurements and research.
The first DNS-OARC workshop was supported by grant NSF OARC DNS SCI CISE SCI-0427144 and hosted by Cisco Systems.
The DNS-OARC workshop brought together key operators of the global Domain Name System and researchers analyzing current DNS behavior as well as new potential approaches to naming and name resolution. Participants discussed:
- ongoing measurements and data collections revealing existing problems in the DNS;
- opportunities for new measurements and laboratory experiments;
- new theoretical naming models.
Publications
The following table contains the papers published by CAIDA for the calendar year of 2005. Please refer to Papers by CAIDA on our web site for a comprehensive listing of publications.
| Year | Author(s) | Title | Publication |
|
2005
|
Crovella, M. Friedman, T. Shannon, C. Spring, N. |
Community-Oriented Network Measurement Infrastructure (CONMI) Workshop Report | CONMI |
|
2005
|
Riley, G. Krioukov, D. Sundaram, R. |
Towards a Topology Generator Modeling AS Relationships | IEEE International Conference on Network Protocols |
|
2005
|
Moore, D. Keys, K. Fomenkov, M. Huffaker, B. Claffy, K. |
The Internet Measurement Data Catalog | ACM SIGCOMM Computer Communications Review (CCR) |
|
2005
|
Krioukov, D. Huffaker, B. claffy, k. Vahdat, A. |
Impact of Degree Correlations on Topology Generators | SIGCOMM Poster |
|
2005
|
Krioukov, D. Riley, G. claffy, k. |
Classifying the Types of Autonomous Systems in the Internet | SIGCOMM Poster |
|
2005
|
Krioukov, D. Fomenkov, M. Huffaker, B. Dimitropoulos, X. claffy, k. Vahdat, A. |
Lessons from Three Views of the Internet Topology: Technical Report | Cooperative Association for Internet Data Analysis (CAIDA) |
|
2005
|
Moore, D. Estan, C. |
A Robust System for Accurate Real-time Summaries of Internet Traffic: Technical Report | Cooperative Association for Internet Data Analysis (CAIDA) |
|
2005
|
Moore, D. Estan, C. |
A Robust System for Accurate Real-time Summaries of Internet Traffic | SIGMETRICS |
|
2005
|
Broido, A. claffy, k. |
Remote physical device fingerprinting | IEEE Symposium on Security and Privacy |
|
2005
|
Krioukov, D. Huffaker, B. claffy, k. Riley, G. |
Inferring AS Relationships: Dead End or Lively Beginning? | Workshop on Efficient and Experimental Algorithms (WEA) |
|
2005
|
Murray, M. Hyun, Y. Brownlee, N. Broido, A. Fomenkov, M. claffy, k. |
Comparison of Public End-to-End Bandwidth Estimation Tools on High-Speed Links | Passive and Active Network Measurement Workshop (PAM) |
|
2005
|
Brownlee, N. claffy, k. |
A Study of Burstiness in TCP Flows | Passive and Active Network Measurement Workshop (PAM) |
|
2005
|
Krioukov, D. Riley, G. |
Revisiting Internet AS-level Topology Discovery | Passive and Active Network Measurement Workshop (PAM) |
|
2005
|
Some Observations of Internet Stream Lifetimes | Passive and Active Network Measurement Workshop (PAM) | |
|
2005
|
Hyun, Y. claffy, k. |
Spectroscopy of traceroute delays | Passive and Active Network Measurement Workshop (PAM) |
Presentations
The following table contains the presentations and invited talks published by CAIDA for the calendar year of 2005. Please refer to Presentations by CAIDA on our web site for a comprehensive listing.
| Author(s) | Title | Venue | Unique Downloads |
| claffy, kc | "apocalypse then": ipv4 address space depletion | American Registry for Internet Numbers (ARIN), Oct '05 | 546 |
| Hyun, Y. Broido, A. Fomenkov, M. claffy, kc |
RFC1918 updates on servers near M and F roots | First DNS-OARC Workshop, Jul '05 | 125 |
| claffy, kc | [Ii]nternet [applications] drivers of growth: 2005-2015 | OIDA Optical Communications, Jun '05 | 446 |
| Huffaker, Bradley | Overview of CAIDA Data Collection, Analysis and Visualization | Internet Initiative Japan, Jun '05 | 728 |
| claffy, kc | top problems of the Internet and what can be done to help | Australian Computer Security Response Team, Information Technology Security Conference 2005 | 2,810 |
| Dimitropoulos,
Xenofontas Krioukov, Dmitri Krioukov Huffaker, Bradley claffy, kc Riley, George |
Inferring AS Relationships: Dead End or Lively Beginning? | 4th Workshop on Efficient and Experimental Algorithms (WEA) 2005 | 45 |
| Dimitropoulos,
Xenofontas Krioukov, Dmitri Krioukov Riley, George |
Revisiting Internet AS-level Topology Discovery | Passive & Active Measurement (PAM) Workshop Mar, 2005 | 66 |
| Shriram, Alok Murray, Margaret Hyun, Young Brownlee, Nevil Broido, Andre Fomenkov, Marina claffy, kc |
Comparison of Public End-to-End Bandwidth Estimation tools on High-Speed Links | Passive and Active Measurement (PAM) workshop, Mar, 2005 | 1,886 |
| Broido, Andre Hyun, Young claffy, kc |
Spectroscopy of Traceroute Delays | Passive & Active Measurement (PAM) Workshop Mar, 2005 | 378 |
| claffy, kc | top problems of the Internet and how you can help | Corporation for Education Network Initiatives in California (CENIC) Mar, 2005 | 1,057 |
Web Site Usage
In 2005, CAIDA's web site continued to attract considerable attention from a broad, international audience. Visitors seem to have particular interest in CAIDA's tools and analysis.
The table below presents the monthly history of traffic to www.caida.org for 2005.
| Month | Unique visitors | Number of visits | Pages | Hits | Bandwidth |
|---|---|---|---|---|---|
| Jan 2005 | 54,704 | 75,653 | 352,409 | 1,718,326 | 45.83 GB |
| Feb 2005 | 51,187 | 70,278 | 287,382 | 1,502,646 | 40.38 GB |
| Mar 2005 | 91,048 | 121,302 | 368,827 | 2,421,389 | 162.21 GB |
| Apr 2005 | 63,329 | 84,749 | 442,294 | 2,210,386 | 74.12 GB |
| May 2005 | 66,881 | 91,398 | 370,915 | 2,099,693 | 66.95 GB |
| Jun 2005 | 104,611 | 207,640 | 1,189,297 | 2,884,488 | 107.85 GB |
| Jul 2005 | 57,472 | 79,979 | 300,816 | 1,470,710 | 44.99 GB |
| Aug 2005 | 56,969 | 78,349 | 309,177 | 1,511,471 | 45.00 GB |
| Sep 2005 | 64,711 | 87,805 | 296,703 | 1,661,668 | 51.39 GB |
| Oct 2005 | 80,369 | 107,764 | 340,554 | 1,953,280 | 64.04 GB |
| Nov 2005 | 85,465 | 112,609 | 337,793 | 1,922,909 | 57.50 GB |
| Dec 2005 | 77,762 | 101,561 | 338,506 | 1,744,434 | 48.49 GB |
| Total | 854,508 | 1,219,087 | 4,934,673 | 23,101,400 | 808.75 GB |
Organizational Chart
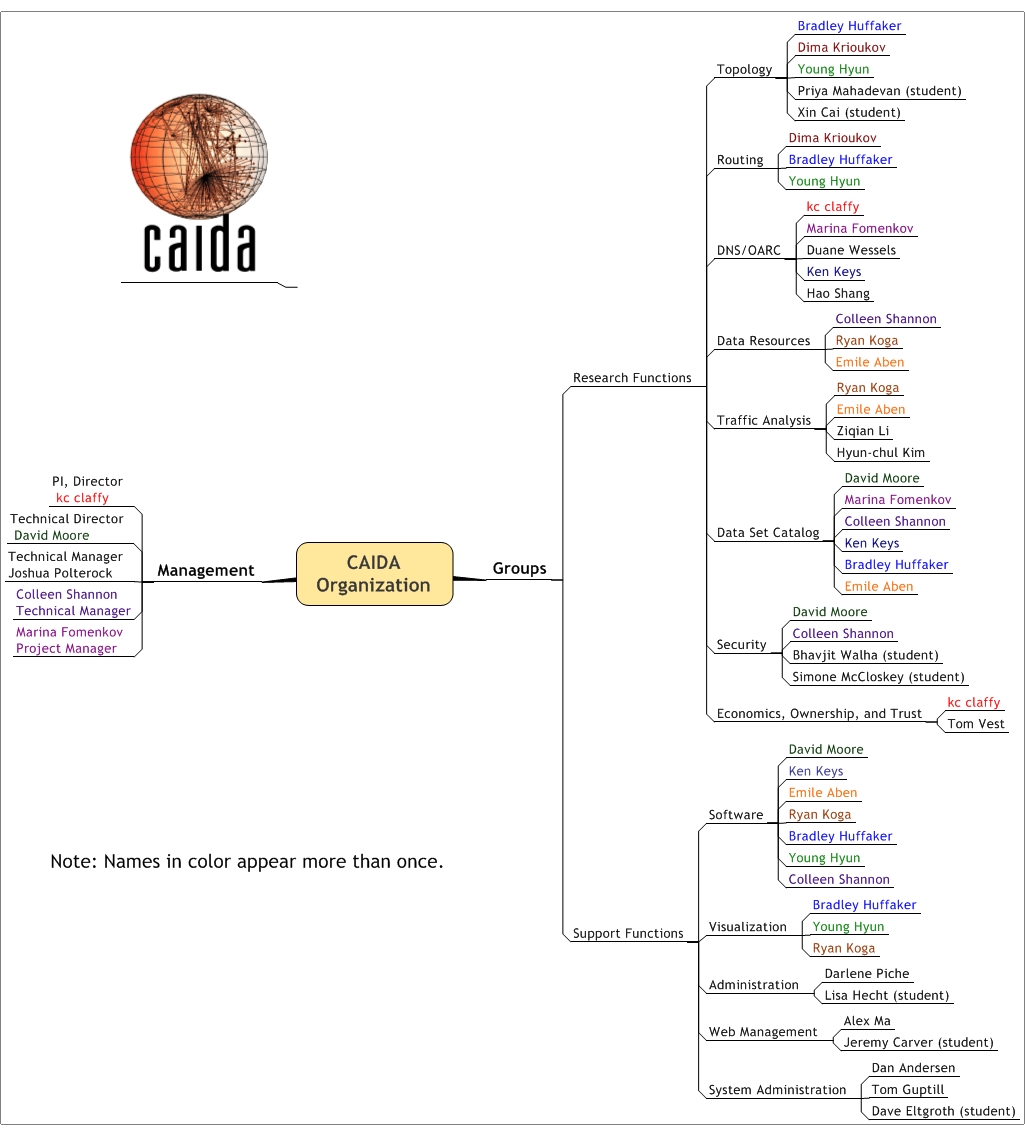
CAIDA would like to acknowledge the many people who put forth great effort towards making CAIDA a success in 2005. The image below shows the functional organization of CAIDA. Please check the home page For more complete information about CAIDA staff.
 |
| CAIDA Functional Organization Chart |
Funding Sources
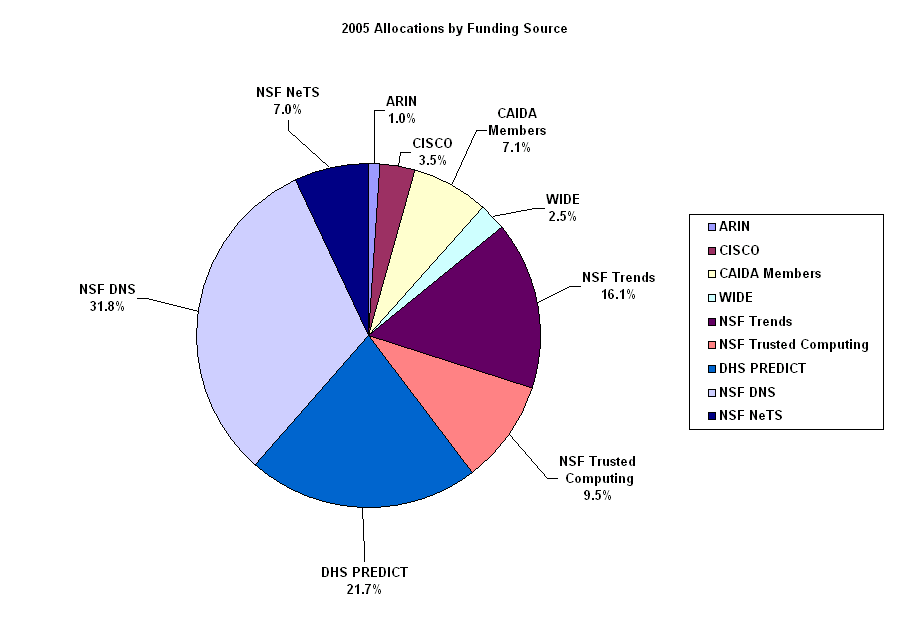
CAIDA feels extremely fortunate to have received funding from a number of diverse sources in 2005. We would like to thank our sponsors, members, and gifting institutions for support. As we aim to promote greater cooperation in the engineering and maintenance of a robust, scalable global Internet infrastructure, CAIDA provides a neutral framework to support cooperative technical endeavors in measurement, analysis, and tool development. We believe our mixed array of funding sources helps to show this neutrality and focus on research.
Figure 1 below depicts CAIDA's Allocations by Funding Source and the percentages each contributed towards CAIDA's total operating expenses for 2005.
 |
| Figure 1. CAIDA 2005 Allocations by Funding Sources |
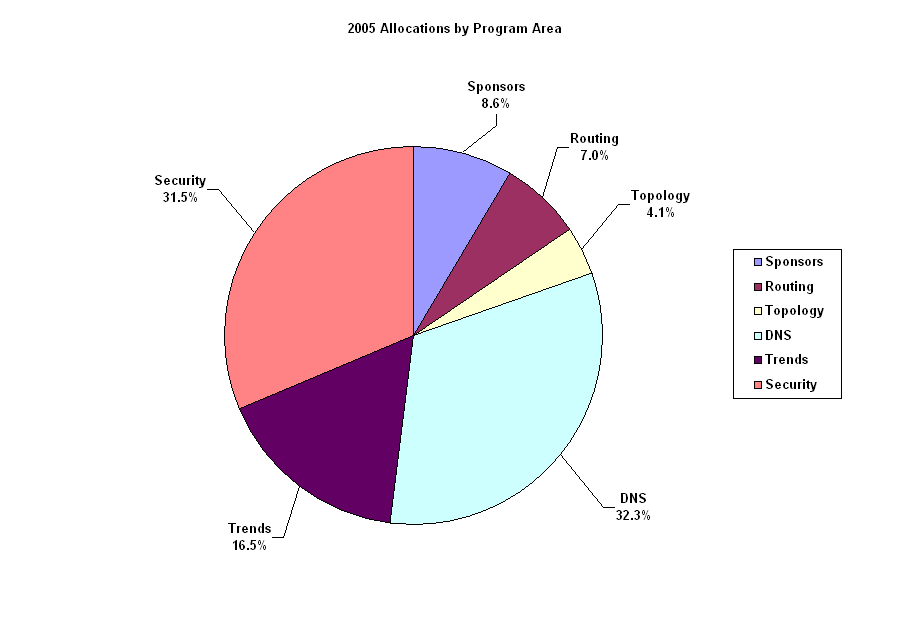 |
| Figure 2. CAIDA 2005 Allocations by Program Area |
Operating Expenses
CAIDA Annual Expense Report for the 2005 calendar year.
| LABOR | Salaries and benefits paid to staff and students | 50.9% | 1,236,126.77 |
| IDC | Indirect Costs paid to the University of California, San Diego including grant overhead (52-54%) and telephone, Internet, and other IT services. | 23.5% | 570,574.40 |
| SUBCONTRACTS | Subcontracts to the Internet Systems Consortium (ISC) and Georgia Institute of Technology | 15.5% | 377,154.59 |
| SUPPLIES & EXPENSES | All office supplies and equipment (including computer hardware and software) costing less than $5000. | 5.4% | 130,027.05 |
| TRAVEL | Trips to conferences, PI meetings, operational meetings, and sites of remote monitor deployment. | 2.6% | 61,972.34 |
| EQUIPMENT | Computer hardware or other equipment costing more than $5000. | 2.1% | 51,473.36 |
| TOTAL | 100% | 2,427,328.51 |
| PROGRAM | LABOR | SUPPLIES & EXPENSES | EQUIPMENT | SUBCONTRACTS | TRAVEL | IDC | TOTAL |
|---|---|---|---|---|---|---|---|
| Sponsors | 171,828.03 | 16,613.69 | 0.00 | 0.00 | 23,000.11 | 7,989.28 | 219,431.11 |
| Routing | 101,114.11 | 8,704.15 | 0.00 | 0.00 | 2,576.46 | 57,166.67 | 169,561.39 |
| Topology | 67,126.02 | 22,181.81 | 0.00 | 0.00 | 2,565.27 | 8,142.01 | 100,015.11 |
| DNS | 251,134.65 | 5,895.15 | 0.00 | 377,154.59 | 4,805.66 | 142,503.64 | 781,493.69 |
| Trends | 216,743.57 | 39,390.35 | 0.00 | 0.00 | 6,895.66 | 130,207.36 | 393,236.94 |
| Security | 428,180.40 | 37,241.89 | 51,473.36 | 0.00 | 22,129.18 | 224,565.44 | 763,590.27 |
| 1,236,126.77 | 130,027.05 | 51,473.36 | 377,154.59 | 61,972.34 | 570,574.40 | 2,427,328.51 |
Does not include salaries or expenses paid by the Computer Science & Engineering Department of the Jacobs School of Engineering at the University of California, San Diego.