

CAIDA's Annual Report for 2016
Mission Statement: CAIDA investigates practical and theoretical aspects of the Internet, focusing on activities that:
- provide insight into the macroscopic function of Internet infrastructure, behavior, usage, and evolution,
- foster a collaborative environment in which data can be acquired, analyzed, and (as appropriate) shared,
- improve the integrity of the field of Internet science,
- inform science, technology, and communications public policies.
Executive Summary
This annual report summarizes CAIDA's activities for 2016, in the areas of research, infrastructure, data collection and analysis. Our research projects span Internet topology mapping, security and stability measurement studies (of outages, interconnection performance, and configuration vulnerabilities), economics, future Internet architectures, and policy. Our infrastructure, software development, and data sharing activities support measurement-based internet research, both at CAIDA and around the world, with focus on the health and integrity of the global Internet ecosystem.
Mapping the Internet. We continued to expand our topology mapping capabilities using our Ark measurement infrastructure. We improved the accuracy and sophistication of our topology annotations, including classification of ISPs, business relationships between them, and geographic mapping of interdomain links that implement these relationships. We released two Internet Topology Data Kits (ITDKs) incorporating these advances.
Mapping Interconnection Connectivity and Congestion. We continued our collaboration with MIT to map the rich mesh of interconnection in the Internet in order to study congestion induced by evolving peering and traffic management practices of CDNs and access ISPs. We focused our efforts on the challenge of detecting and localizing congestion to specific points in between networks. We developed new tools to scale measurements to a much wider set of available nodes. We also implemented a new database and graphing platform to allow us to interactively explore our topology and performance measurements. We produced related data collection and analyses to enable evaluation of these measurements in the larger context of the evolving ecosystem: infrastructure resiliency, economic tussles, and public policy.
Monitoring Global Internet Security and Stability. We conducted infrastructure research and development projects that focus on security and stability aspects of the global Internet. We developed continuous fine-grained monitoring capabilities establishing a baseline connectivity awareness against which to interpret observed changes due to network outages or route hijacks. We released (in beta form) a new operational prototype service that monitors the Internet, in near-real-time, and helps identify macroscopic Internet outages affecting the edge of the network. CAIDA also developed new client tools for measuring IPv4 and IPv6 spoofing capabilities, along with services that provide reporting and allow users to opt-in or out of sharing the data publicly.
Future Internet Architectures. We continued studies of IPv4 and IPv6 paths in the Internet, including topological congruency, stability, and RTT performance. We examined the state of security policies in IPv6 networks, and collaborated to measure CGN deployment in U.S. broadband networks. We also continued our collaboration with researchers at several other universities to advance development of a new Internet architecture: Named Data Networking (NDN) and published a paper on the policy and social implications of an NDN-based Internet.
Public Policy. Acting as an Independent Measurement Expert, we posted our agreed-upon revised methodology for measurement methods and reporting requirements related to AT&T Inc. and DirecTV merger (MB Docket No. 14-90). We published our proposed method and a companion justification document. Inspired by this experience and a range of contradicting claims about interconnection performance, we introduced a new model describing measurements of interconnection links of access providers, and demonstrated how it can guide sound interpretation of interconnection-related measurements regardless of their source.
Infrastructure operations. It was an unprecedented year for CAIDA from an infrastructure development perspective. We continued support for our existing active and passive measurement infrastructure to provide visibility into global Internet behavior, and associated software tools and platforms that facilitate network research and operational assessments. We made available several data services that have been years in the making: our prototype Internet Outage Detection and Analysis service, with several underlying components released as open source; the Periscope platform to unify and scale querying of thousands of looking glass nodes on the global Internet; our large-scale Internet topology query system (Henya); and our Spoofer system for measurement and analysis of source address validation across the global Internet. Unfortunately, due to continual network upgrades, we lost access to our 10GB backbone traffic monitoring infrastructure. Now we are considering approaches to acquire new monitors capable of packet capture on 100GB links.
As always, we engaged in a variety of tool development, and outreach activities, including maintaining web sites, publishing 13 peer-reviewed papers, 3 technical reports, 4 workshop reports, one (our first) BGP hackathon report, 31 presentations, 20 blog entries, and hosting 6 workshops (including the hackathon). This report summarizes the status of our activities; details about our research are available in papers, presentations, and interactive resources on our web sites. We also provide listings and links to software tools and data sets shared, and statistics reflecting their usage. Finally, we report on web site usage, personnel, and financial information, to provide the public a better idea of what CAIDA is and does.
CAIDA's program plan for 2014-2017 is available at www.caida.org/about/progplan/progplan2014/. We will develop a new program plan for 2018-2021 later this year. Please send comments or questions to info at caida dot org.
Research and Analysis
Internet Topology Mapping, Measurement, Analysis, and Modeling
Maps of the Internet topology are an important tool for characterizing this critical infrastructure and understanding its macroscopic properties, dynamic behavior, performance, and evolution. They are also crucial for realistic modeling, simulation, and analysis of the Internet and other large-scale complex networks. These maps can be constructed for different layers (or granularities), e.g., fiber/copper cable, IP address, router, Points-of-Presence (PoPs), autonomous system (AS), ISP/organization. Router-level and PoP-level topology maps can powerfully inform and calibrate vulnerability assessments and situational awareness of critical network infrastructure. ISP-level topologies, sometimes called AS-level or interdomain routing topologies (although an ISP may own multiple ASes, so an AS-level graph is a slightly finer granularity) provide insights into technical, economic, policy, and security needs of the largely unregulated peering ecosystem. With support from the Department of Homeland Security (DHS) and the National Science Foundation (NSF), we continued support for our active measurement infrastructure Archipelago (Ark), which captures the most comprehensive set of Internet topology data made available to the research community. (The Ark measurement infrastructure also supports cybersecurity and other network research and experimentation, described below.)
We continued our collaboration with MIT Computer Science and Artificial Intelligence Laboratory (MIT/CSAIL), on an NSF-funded MANIC project Measurement and Analysis of Interdomain Congestion. For this project we are developing techniques to measure congestion on interdomain links between ISPs, and investigate questions related to infrastructure resiliency, scientific modeling, network economics, and public policy. Our activities included developing and operationalizing methods for identification of borders between IP networks, building a scalable system for collecting and analyzing interdomain performance measurements, designing a system to augment our own measurements with those from thousands of other vantage points on the Internet, and exploring new techniques to improve real-time AS-level inference of paths.
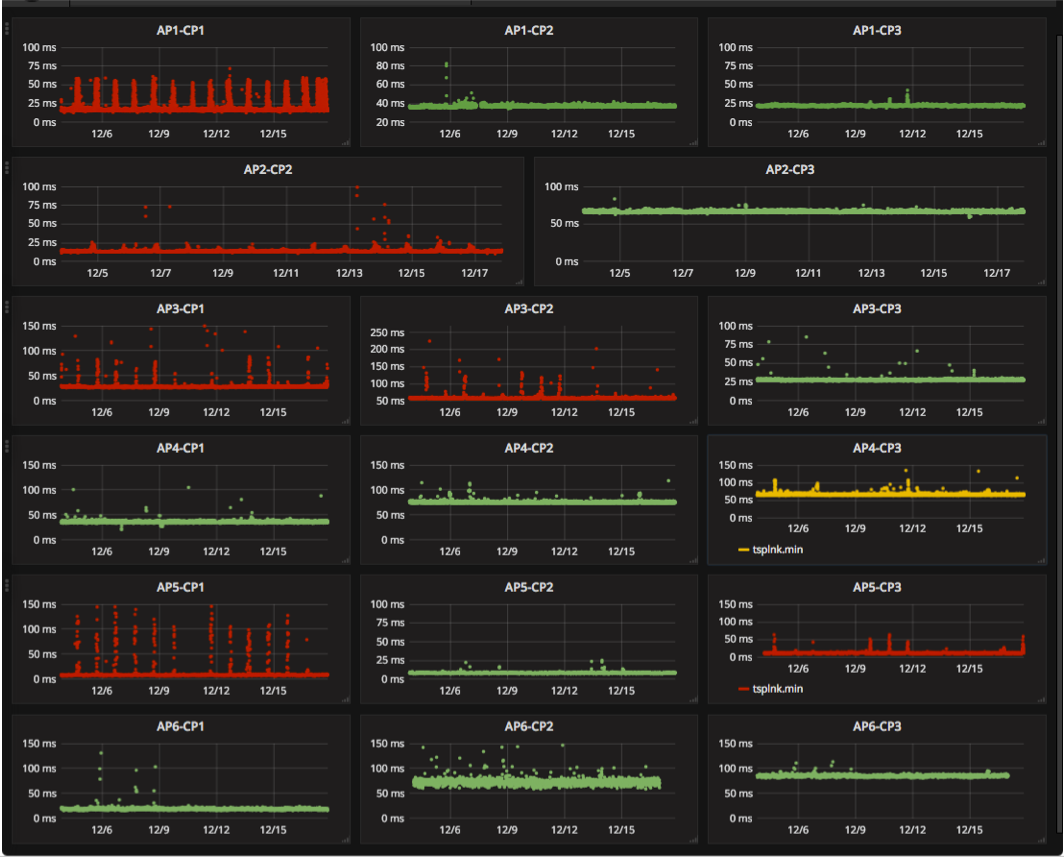 Figure 1. A screenshot of a beta version dashboard
by the Mapping Interconnection in the Internet: Colocation,
Connectivity and Congestion Project that displays evidence
of potential congestion at ISP interconnection points.
Figure 1. A screenshot of a beta version dashboard
by the Mapping Interconnection in the Internet: Colocation,
Connectivity and Congestion Project that displays evidence
of potential congestion at ISP interconnection points.
Identification of borders between IP networks. In collaboration with Matthew Luckie (U. Waikato), who led this activity, we developed the first rigorous method to accurately identify a border router, and its owner, from traceroute data. In 2015 and 2016 we worked on heuristics that built on CAIDA's proven experience in inferring AS relationships and router-level topology to tackle this challenge. We implemented these heuristics in bdrmap, a probing measurement tool that uses vantage points inside the network to accurately infer the boundaries of that network, and the other networks attached at each boundary. We put this tool into production in 5-6 nodes back in 2014, but by December 2016 bdrmap was running on 67 Ark nodes (bdrmap: Inference of Borders Between IP Networks, IMC).
System for collecting and analyzing interdomain congestion measurements. We continued work on developing a comprehensive backend system that manages latency probing from our set of distributed vantage points, collects and organizes data, and presents that resulting time-series latency probing (TSLP) data for easy analysis and visualization. As of December 2016 we were running these latency measurements (along with bdrmap) from over 67 Archipelago VPs in 52 networks and 27 countries around the world. We made major advances in visualization and analysis of the generated time series data. We used influxDB, which can handle millions of time series, and Grafana, a graphing front end that integrates seamlessly with the influxDB database to provide interactive querying and graphing capability. The system now provides a near real-time view of congestion events, pulling TSLP data off our VPs and indexing it into the influxDB database within 30 minutes after collection. Now that we have this infrastructure in place, we have begun a comprehensive analysis of the congestion data collected from all our Vantage Points over the last two years, and are exploring multiple methods (level-shift detection, FFT-based) to automate detection of evidence of congestion across thousands of interconnection points, along both spatial and temporal dimensions. Figure 1 provides a sample dashboard screenshot of our MANIC observatory, displaying evidence of congestion at select interconnects (anonymized view). In 2017 we plan to report results of this work and publish a curated view of the gathered data.
Expanding measurement coverage using global fabric of looking glasses. Even a few hundred vantage points can provide only a limited view of the Internet topology. To leverage observability of topology from thousands of networks around the world that host looking glass servers (LGs, which support BGP and traceroute queries from external users), we developed an interface called Periscope, a publicly-accessible overlay that unifies LGs into a single platform and automates the discovery and use of LG capabilities. The system architecture combines crowd-sourced and cloud-hosted querying mechanisms to automate and scale the available querying resources. Periscope can handle large bursts of requests, with an intelligent controller coordinating multiple concurrent user queries without violating the various LG querying rate limitations. In our design paper, we compared Periscope's querying capabilities and coverage with those of two major measurement platforms (RIPE Atlas and Ark). We demonstrated the utility of having co-located BGP and traceroute vantage points with two case studies involving the validation of IP-to-AS mapping, and the geolocation of border router interfaces. Our results show that Periscope significantly extends our view of Internet topology obtained through RIPE Atlas and CAIDA's Ark, while the combination of traceroute and BGP measurements allows more sophisticated measurement studies (Periscope: Unifying Looking Glass Querying, PAM).
Improvement of real-time ISP-level topology mapping methods. Since AS path inferences based on control-plane (BGP) data sometimes lead to inaccuracies, researchers have long attempted to use traceroute-based inferences to mitigate these inaccuracies, albeit without a formal framework for doing so. To improve the state-of-the-art in this area, we continued investigating techniques for translating traceroute-observed IP paths into AS paths. Using the Periscope infrastructure (described below), we collected and sanitized large sets of traceroute-observed paths to evaluate various inference approaches. Our goal is to develop a methodology that would intelligently combine proven inference heuristics to improve accuracy. As of 2016, we have implemented an alpha version of a subset of the heuristics, and we hope to produce a more complete version of this methodology in 2017.
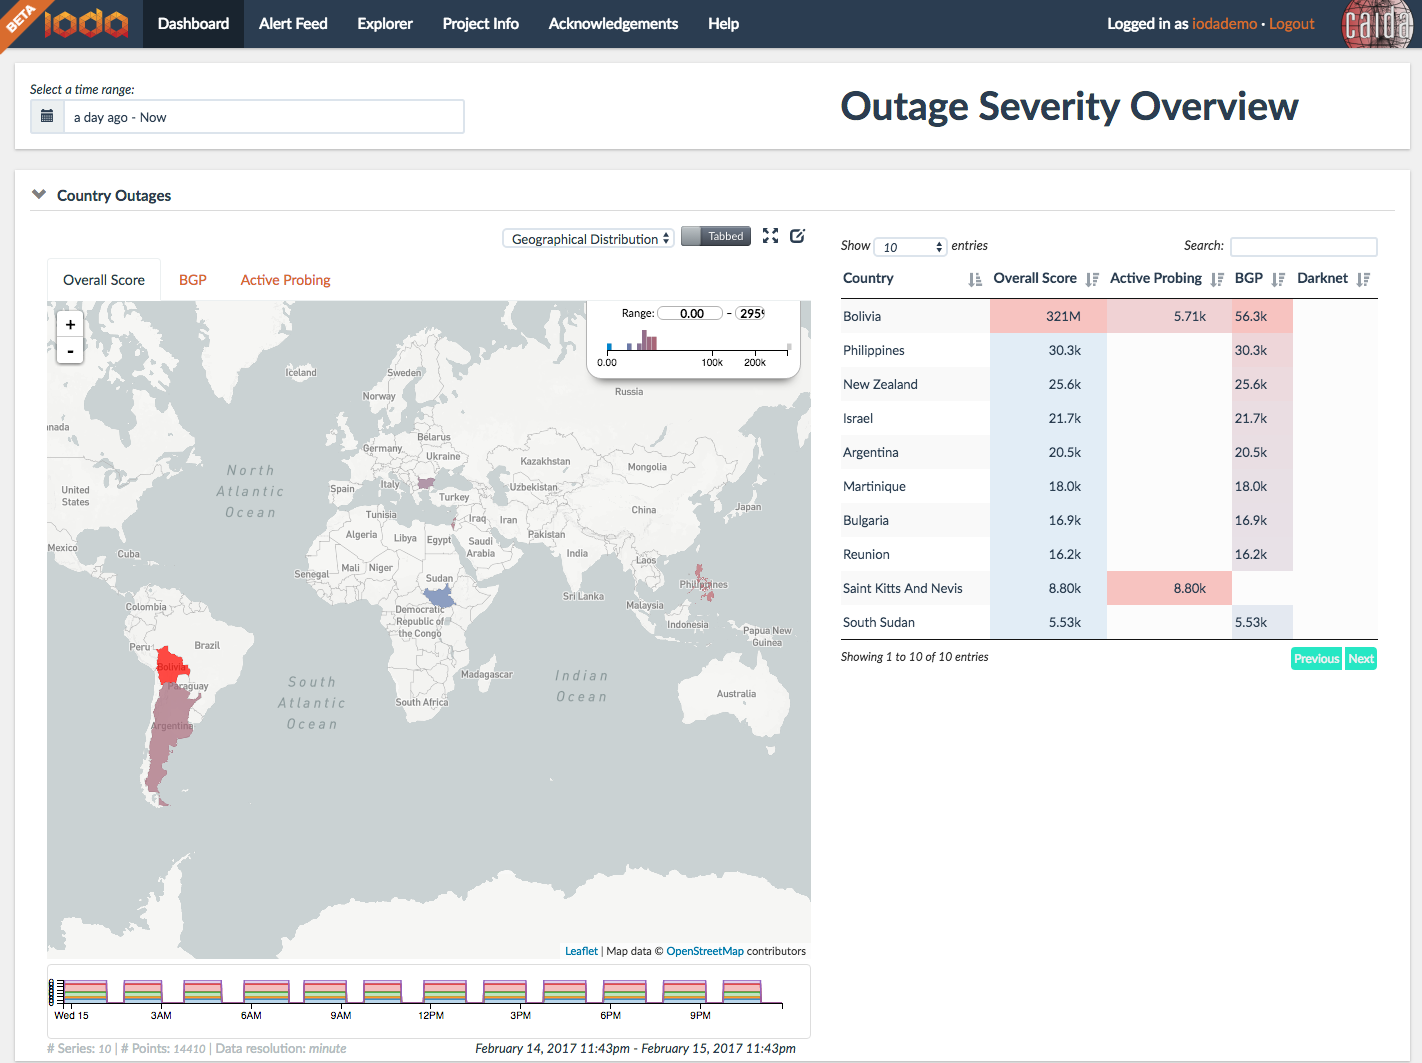 Figure 2. Screenshot of a dashboard
of the Internet
Outage Detection and Analysis (IODA) system showing a country-level
view of outages.
Figure 2. Screenshot of a dashboard
of the Internet
Outage Detection and Analysis (IODA) system showing a country-level
view of outages.
Monitoring Global Internet Security and Stability
Our research in Internet security and stability monitoring in 2016 focused on three areas: 1) use of crowd-sourced measurement to estimate lack of source address validation, a well-known, long-standing infrastructure vulnerability; 2) fusion of heterogeneous data sources to support analysis of Internet outage episodes (e.g., networks, regions, and protocols affected over which periods); 3) methodologies to detect and characterize BGP-based traffic interception events (hijacking). All three areas required significant development and operations of complex monitoring infrastructure and analysis platforms.
Software Systems for Surveying Spoofing Susceptibility. Seeking to minimize Internet's susceptibility to spoofed DDoS attacks, we are developing and supporting open-source software tools to assess and report on the deployment of source address validation (SAV) best anti-spoofing practices. This project includes applied research, software development, new data analytics, systems integration, operations and maintenance, and an interactive reporting service. In May 2016 we released a new client-server system for Windows, MacOS, and UNIX-like systems that periodically tests a network's ability to send packets with forged source IP addresses (spoofed packets). In the case of a positive spoofing test, the system generates notifications that we manually send to a registered technical contact for the AS in question. We are also producing reports and visualizations to inform operators, response teams, and policy analysts. Reports include recently run tests, results by AS, results by country, and results by provider. We announced and solicited feedback on this new system at network operator and policy forums including NANOG, AusNOG, and ICANN's SSAC. In 2017 we will release an educational video that explains the importance of supporting this project by installing the tool on laptops.
Internet Outage Detection and Analysis (IODA). We developed and deployed automated outage detection and alerting platform based on reachability signals extracted from three Internet measurement data sources: Internet Background Radiation (IBR), Border Gateway Protocol (BGP), and active probing. Our outage inference system combines information from these three data sources, establishes the relevance of an event and generates alerts. The outage events and the corresponding signals obtained through automated analysis are displayed on dashboards (Figure 2) and interactive graphs that allow the user to track and further investigate recent and historical events. Our IODA project website provides a high-level view of the IODA architecture and links to an experimental 24/7 service accessible at ioda.caida.org. We disseminated our results at relevant meetings (NANOG, IETF, ACM, etc.), as well as to government agencies (FCC, DHS) and operators (Comcast).
Baseline monitoring for situational awareness As part of an NSF-funded project to study BGP hijacks, we deployed daily probing from a subset of Ark monitors, toward all BGP-announced IPv4 prefixes, using BGPStream to gather BGP prefixes from the RIPE-RIS and Route Views data services. Each monitor probes the entire set of targets independently, and each monitor completes exactly one pass of the target set every calendar day (aligned on UTC boundaries). We make the IPv4 Prefix-Probing Dataset available for download under our standard acceptable use agreement for restricted data. (Also see Data section below.)
Future Internet Research
The Internet protocol standards development organization (the IETF) spent over a decade developing the IPv6 architecture, intending it to ultimately replace IPv4 with an expanded address space. Uptake of the IPv6 protocol has languished, and may not offer enough new functionality and capability to accommodate the needs of emerging communication environments, most specifically, the Internet of Things and its cellular industry cousin, 5G. For over six years, NSF and other research funding agencies around the world have invested in research on new Internet architectures, including resources to fund software prototypes, national-scale testbeds, and evaluation of candidate architectures. We continue to engage in long-term studies of both IPv6 evolution, adaptation of IPv4 technology to IPv4 address scarcity (e.g., CGN), and an entirely new proposed protocol architecture: Named Data Networking.
IPv6: Measuring and Modeling the IPv6 Transition
Measurement of IPv6 Topology Structure. Our IPv6 measurement work has in past years focused on improving the fidelity, scope, and usability of IPv6 measurement technology. We continued measurements of IPv6 topology using our Ark measurement platform. As of the end of 2016, we had 67 Ark monitors capable of IPv6 probing. (See Data section below for data collection statistics over time.)
Developing methods to detect the presence of Carrier-Grade NAT (CGN) in ISP networks. In collaboration with researchers at University Carlos III Madrid, we developed and deployed NAT Revelio, a novel test suite methodology for use in residential or other edge broadband networks to detect NAT deployments beyond the home gateway within the ISP access network also known as NAT444 (e.g., Carrier Grade NAT). Since NAT444 solutions may impair performance for some users, understanding the extent of NAT444 deployment in the Internet is of interest to policymakers, ISPs, and users. To detect NAT444, the Revelio test suite aims to determine the location of the device translating the private address used inside the home to the globally routable public IP address that identifies the subscriber to the global Internet. If we find that the subscriber's home network does not host this device, we conclude that the ISP deploys NAT444. After the initial study (NAT Revelio: Detecting NAT444 in the ISP, PAM 2016), we collaborated to deploy Revelio on the FCC's large-scale measurement platform (operated by SamKnows) in the U.S., where we found very little use of CGN. We will publish these results in 2017.
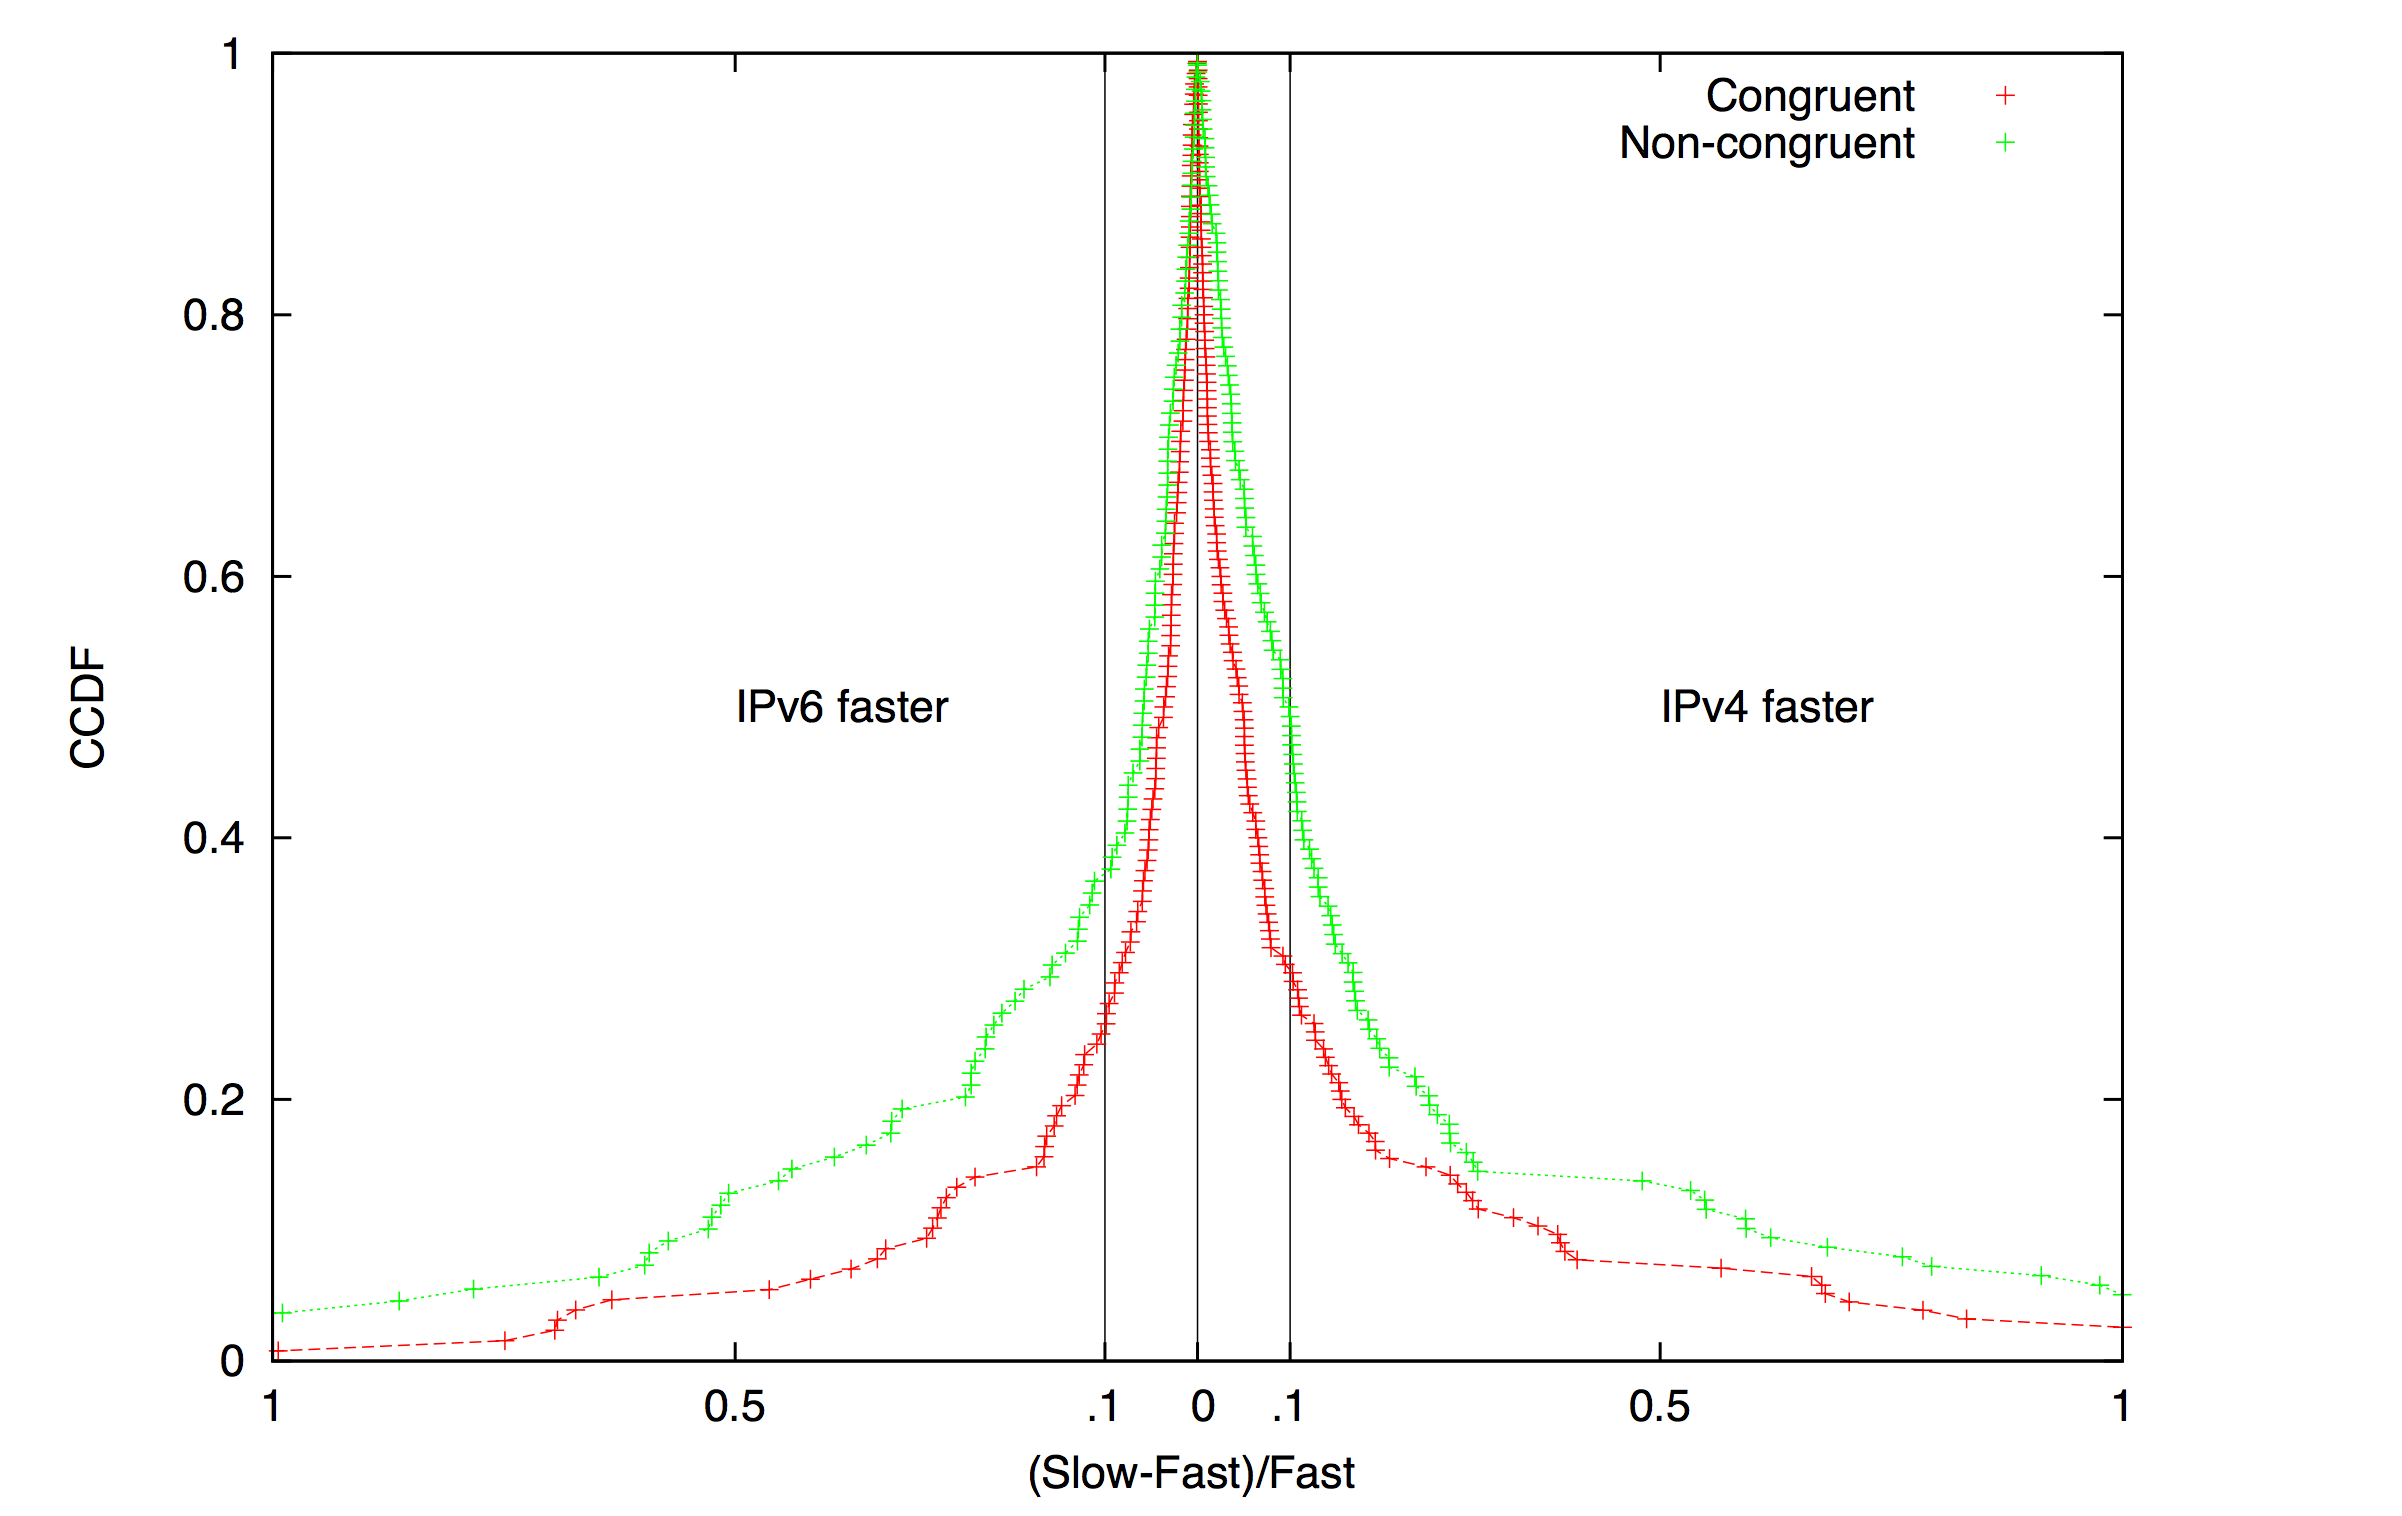 Figure 3. Relative RTT average values
(over a 38-day probing period) over IPv4 and IPv6.
The region to the right of 0 constitutes cases where IPv4 was
faster than IPv6, i.e., RTTs were lower over IPv4 than IPv6;
this region accounts for 55% of the (monitor,target) pairs.
The region to the left is when IPv6 was faster than IPv4,
and accounts for 45% of the (monitor,target) pairs.
AS-level path congruency (between IPv4 and IPv6) is still
strongly correlated with comparable performance.
We observed a notable improvement in IPv6 performance
over previous studies
(Characterizing IPv6 control and data plane stability, INFOCOM 2016).
Figure 3. Relative RTT average values
(over a 38-day probing period) over IPv4 and IPv6.
The region to the right of 0 constitutes cases where IPv4 was
faster than IPv6, i.e., RTTs were lower over IPv4 than IPv6;
this region accounts for 55% of the (monitor,target) pairs.
The region to the left is when IPv6 was faster than IPv4,
and accounts for 45% of the (monitor,target) pairs.
AS-level path congruency (between IPv4 and IPv6) is still
strongly correlated with comparable performance.
We observed a notable improvement in IPv6 performance
over previous studies
(Characterizing IPv6 control and data plane stability, INFOCOM 2016).
Comparing IPv6 Control and Data Plane Stability with IPv4. The stability of IPv6 -- both in the control and data plane -- is an important determinant of end-to-end performance. We conducted a measurement study of control and data plane stability of IPv6, and compared it to IPv4. To characterize control-plane stability, we measured the frequency of routing changes toward IPv4 and IPv6 prefixes, the number of prefixes experienced routing changes on a daily basis, the contribution of highly active prefixes to routing dynamics, and correlations between routing instability in IPv4 and IPv6. To characterize data-plane stability, we measured IPv4 and IPv6 reachability from several vantage points, and relative RTT performance and stability. We found most routing dynamics were generated by a small fraction of pathological unstable prefixes. In the data-plane, episodes of unavailability were longer on IPv6 than on IPv4. We found evidence of correlated performance degradation over IPv4 and IPv6 caused by shared infrastructure (Characterizing IPv6 control and data plane stability, INFOCOM 2016; See Figure 3).
Characterization of IPv6 Network Security Policy. We empirically examined the extent to which IPv6 security policy is also properly configured for IPv6. In our measurement survey of 520K dual-stacked servers and 25K routers, we found high-value target applications with a comparatively open security policy in IPv6 including services (SSH, Telnet, SNMP, BGP) often more than twice as open on IPv6 routers and servers as they are in IPv4. We found that protocol openness (e.g. port blocking) discrepancies were consistent within network boundaries, suggesting a systemic failure in organizations to deploy consistent security policy. We successfully communicated our findings to twelve network operators and all twelve confirmed that the relative openness was unintentional. Ten of the twelve immediately moved to deploy a congruent IPv6 security policy, reflecting real operational concern. Finally, we revisited the belief that the security impact of this comparative openness in IPv6 was mitigated by the infeasibility of IPv6 network-wide scanning - we found that, for both of our datasets, host addressing practices made discovering these high-value hosts feasible by scanning alone. To help operators accurately measure their own IPv6 security posture, we made our scanning tool publicly available as part of the scamper tool package. Matthew Luckie studied this problem in collaboration with researchers from ICSI Center for Internet Research, University of Illinois at Urbana-Champaign, and University of Michigan when he was at CAIDA; the results were published after he moved to the University of Waikato (Don't Forget to Lock the Back Door! A Characterization of IPv6 Network Security Policy, NDSS).
Named Data Networking: Next Phase
The NDN project (http://www.named-data.net/) investigates Van Jacobson's proposed evolution from today's host-centric network architecture (IP) to a data-centric network architecture (NDN). This conceptually simple shift has far-reaching implications for how we design, develop, deploy, and use networks and applications. By naming data instead of locations, this architecture aims to transition the Internet from its current reliance on where data is located (addresses and hosts) to what the data is (the content that users and applications care about). Our activities for this project included research on new NDN-compatible routing protocols (via a subcontract with Dima Krioukov now at Northeastern University), testbed participation, and overall management support. Our management responsibilities included coordination and scheduling among the seven institutions for research activities, weekly management and other strategy calls with PIs, as well as monthly newsletters to NDN Consortium members, and the project wiki.
Experimental Investigation of Hyperbolic Routing. We compared packet delivery delay and overhead under Hyperbolic Routing (HR) with Named-Data Link State Routing (NLSR), which calculates shortest paths. To test HR, we ran emulation experiments with various topologies with different failure scenarios, probing intervals, and maximum number of next hops for a name prefix. We estimated delays between ASes based on geographical distances and generated minimum navigable network topologies with minimum stretch for the NDN testbed. Our evaluations show that HR's forwarding plane overhead in such networks is much lower than NLSR's control overhead, while achieving similar packet delay and loss rates. Most importantly, we have shown that as a function of the network size, HR's per-node message overhead is almost constant and close to zero, versus the usual polynomial growth experienced by traditional link state routing. Taken together, these results suggest that HR has the potential to be an extremely scalable routing solution for NDN and other network architecture. Yet, several technical issues require further investigation. These include mechanisms to compute and distribute hyperbolic coordinates in a decentralized manner, properly taking into account link delays. We caveat these results with the understanding that this does not take into account any policy ( An Experimental Investigation of Hyperbolic Routing with a Smart Forwarding Plane in NDN, IEEE IWQoS).
Policy implications of Named Data Networking. In collaboration with other NDN colleagues (at the University of Maryland and UCLA), we explored the social impacts of NDN, with a particular focus on content producers and consumers. Targeting a general audience, we described how NDN uses data names for routing and forwarding, provides per-packet data signatures, and leverages in-network storage. We described how NDN-based networking could expand options for free speech, security, privacy, and anonymity, while raising new challenges regarding data retention and intellectual property management. We addressed impacts on governments and content industries caused by changing the way networked data is identified, handled, and routed. This anticipatory analysis suggests research questions and areas of technical focus for ongoing NDN research, and helps us better understand the potential consequences of information-centric networking (Anticipating Policy and Social Implications of Named Data Networking, CACM).
NDN Community Outreach. We published the summary report (CCR January) for the 2nd NDN Community Meeting . We hosted and published slides and related materials for the 6th (March) and 7th (November) NDN Project Retreats held at the San Diego Supercomputer Center on the UCSD campus. We guest lectured at a UCSD CSE graduate seminar on Information Centric Networking (ICN), and participated in a USENIX LISA Conversations talk show series (April 2016).
NDN Testbed. We continued to maintain a local UCSD hub on the national NDN testbed using the NDN Platform software running on an Ubuntu server on SDSC's machine room floor. We also host a desktop computer configured with NDN-based video and audio software (provided by UCLA Center for Research in Engineering, Media, and Performance) to support team experiments and testing of instrumented environments, participatory sensing, and media distribution using NDN.
Economics and Policy
We study the Internet ecosystem from an economic perspective, capturing relevant interactions between network business relations, interdomain network topology, routing policies, and resulting interdomain traffic flows. We also provide technical guidance to policymakers as needed to inform industry tussles and telecommunication policies.
Technical Guidance on Measuring Internet Interconnection Performance Metrics. Interconnection links connecting access providers to their peers, transit providers and major content providers are a potential point of discriminatory treatment and impairment of user experience. Pursuant to the FCC order 15-94 approving the AT&T/DirecTV merger, sensitive to many public comments on this interconnection discrimination issue during the merger review, in late 2015 and 2016 AT&T engaged CAIDA as an Independent Measurement Expert to develop a methodology for AT&T to use to measure and report metrics related to performance of its interconnections. (See Statement of work). The final methodology was published in June as the First Amended Report of AT&T Independent Measurement Expert: Reporting requirements and measurement methods. A letter AT&T sent to the FCC in August ratified this methodology. We also published a companion document with justification and explanation of this methodology.
Policy challenges in mapping Internet interdomain congestion. In the U.S., the FCC has asserted regulatory authority over interconnection links, although they have acknowledged they lack sufficient expertise to develop appropriate regulations thus far. Without a basis of knowledge that relates measurement to justified inferences about actual impairment, different actors can put forward opportunistic interpretations of data to support their points of view. We introduced a topology-aware model of interconnection, to add clarity to a recent proliferation of data and claims, and to elucidate our own beliefs about how to measure interconnection links of access providers, and how policymakers should interpret the results. This model distinguishes itself from existing models by capturing nested aggregations of links between access providers and their interconnecting parties. We discussed the tradeoffs and limitations of examining data at different aggregation granularities, and how to use them to evaluate the relative significance of performance impairment, and the legitimacy of reported data and analysis. We demonstrated the utility of our conceptual model by applying it to six case studies that span data sets offered by access providers, edge providers, academic researchers, and the AT&T example mandated by the FCC. These case studies show how our conceptual model can guide a critical analysis of what is or should be measured and reported, and how to soundly interpret these measurements (Policy challenges in mapping Internet interdomain congestion, TPRC).
Workshop on Internet Economics (WIE). We hosted the 7th annual Workshop on Internet Economics (WIE), bringing together researchers, commercial Internet facilities and service providers, technologists, economists, theorists, policy makers, and other stakeholders to empirically inform emerging regulatory and policy debates. This year we first returned to the list of aspirations we surveyed at the 2014 workshop, and described the challenges of mapping them to actions and measurable progress. We then reviewed evolutionary shifts in traffic, topology, business, and regulatory models, and (our best understanding of) the economics of the ecosystem. These discussions inspired an extended thought experiment for the second day of the workshop: outlining a new telecommunications legislative framework, including proposing a set of goals and scope of such regulation, and minimal list of sections required to pursue and measure progress toward those goals. There was broad interest in creating a dedicated series of workshops structured around the proposition of new telecommunications legislation, which would incorporate empirically grounded assessments of lessons learned from previous legislative efforts. The report highlights the discussions and presents relevant open research questions identified by participants (Workshop on Internet Economics Final Report, CCR).
Measurement Infrastructure and Data Sharing Projects
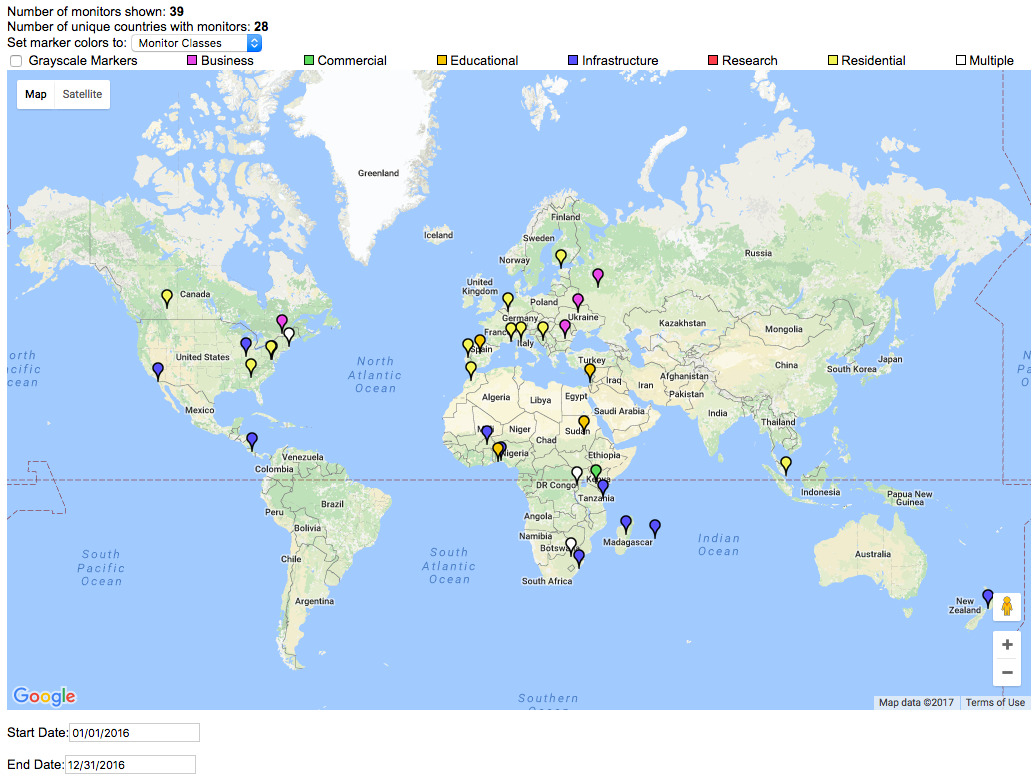 Figure 4. A screenshot of Archipelago Monitor Locations, filtering
with activation dates in 2016. For complete map see
Archipelago Monitor Locations.
Figure 4. A screenshot of Archipelago Monitor Locations, filtering
with activation dates in 2016. For complete map see
Archipelago Monitor Locations.
Archipelago (Ark)
CAIDA has conducted measurements of the Internet topology since 1998. Our current tools (since 2007, scamper deployed on the Archipelago measurement infrastructure) track global IP level connectivity by sending probe packets from a set of source monitors to millions of geographically distributed destinations across the IPv4 address space. Since 2008, Ark has continuously probed IPv6 address space as well. In addition to supporting these continuous measurements, Ark provides a secure and stable platform for researchers to run their own vetted experiments. By providing multiple modes of access to the infrastructure, we seek to reduce the effort needed to develop, deploy and conduct sophisticated experiments. We maintain a list of experiments hosted on the Ark infrastructure and data, and regularly email the principal researchers with updates and important news.
Archipelago vantage point deployments. We deployed a total of 39 new vantage points in 2016 (Figure 4). In particular, to inform infrastructure development in the African region, in collaboration with visiting graduate student Roderick Fanou from the University Carlos III Madrid, we deployed 15 new Ark vantage points in the African region bringing the total for the continent to 22 nodes by the end of 2016 (Also at Archipelago Monitors Locations map, CAIDA).
Internet topology query system. After 1.5 years of development, in November we finally released our large-scale Internet topology query system (Henya) to allow easier access to and promote the analysis of the available wealth of CAIDA's topology data. The Henya system provides full remote access to terabytes of traceroute data from the command-line, enabling researchers to execute queries and write their own analysis and visualization scripts. We also support simplified access via the Vela web interface. Henya includes built-in analyses and visualizations for commonly occurring needs, and is intended to be responsive enough for interactive data exploration. Hoping to widen the audience and to cater to the long tail of casual users, we created a video illustrating Henya's capabilities.
Architecture for adaptive/reactive measurements. We continued work on implementing an architecture for performing adaptive/reactive measurements, e.g., loss rate or throughput measurement tests based on the results of latency probing. We developed a prototype framework for dispatching triggered measurements to Ark VPs via a rabbitMQ-based message queueing system (Toward a Congestion Heatmap of the Internet, CAIDA).
Hosted measurements. The Ark platform also hosted other experiments, including acting as probe receivers for the Spoofer Project, measurement surveys to infer TCP vulnerabilities, measurements to infer borders between ISPs (bdrmap: Inference of Borders Between IP Networks, IMC best paper), and experiments to investigate IPv4 and IPv6 stability (Characterizing IPv6 control and data plane stability, INFOCOMM), to localize middleboxes (boxMap, University of Waterloo), and to study Internet transport evolution (Using UDP for Internet Transport Evolution, ETH TIK).
Scamper
CAIDA has been conducting measurements of the Internet macroscopic topology since 1998. Our tools - first skitter (1998-2008), now scamper (2007-present) have been tracking global IP level connectivity by sending probe packets from a set of source monitors to millions of geographically-distributed destinations in the IPv4 and IPv6 address space.
Improvements to scamper probing tool. Matthew Luckie (U. Waikato) developed a method and implementation to move the bulk of the resource-intensive processing from the VPs to a central controller at CAIDA, so the VP only has to run an efficient probing engine (scamper) with a small memory footprint and low CPU usage. Specifically, he added remote control socket functionality to scamper, which allow a remote scamper processes to connect to a central machine, and then a single process on that machine can coordinate probing among many monitors. This development allowed us to experimentally deploy our congestion probing on resource-constrained platforms such as Princeton's Bismark infrastructure, and will perhaps eventually allow us to deploy these measurements on the FCC Measure Broadband America infrastructure (Scamper Release 20161204, CAIDA).
Periscope: Unifying Looking Glass Querying
We developed and released Periscope, a platform that unifies the disparate LG interfaces into a standardized publicly-accessible querying API that supports on-demand measurements. This API is essentially a middleware interface to looking glass server nodes, with options to retrieve measurements status, search by type of measurement, and create new measurements. The core of the Periscope architecture is a central controller that coordinates queries from multiple users to prevent concurrent requests to the same LG from violating rate limits configured by that LG. We continue improvements to Periscope and began accepting Periscope account requests for early access to the platform.
IODA software components
We implemented automated criteria detecting signal level shifts for each data source (BGP monitoring, unsolicited traffic reaching the UCSD Network Telescope, and active probing) at various aggregation granularities, e.g., AS, country. Our system modules store alerts in a relational database, email alert notifications, and generate reachable/unreachable time series. A web-based dashboard presents a combination of the alert data and time-series data and enables deeper inspection of identified connectivity disruptions.
We packaged and released as open source many components of the IODA platform: BGPStream - a framework for BGP data analysis (see BGPStream below); DBATS - a high-performance and highly-scalable time series database; and libtimeseries - a C library to support efficiently writing to time series databases. It supports the Graphite ASCII format and TSMQ (Time Series Message Queue) backends, as well as our DBATS backend. We refined our BGP data processing framework to perform real-time filtering of noise in BGP measurement data (e.g., misconfiguration and route leaks from some BGP monitors). We extended our BGPCorsaro routing-tables plugin with heuristics to identify and discard routing table information from peers that do not share a full routing table, and we added prefix-based filters to identify and remove spurious route announcements (e.g., prefixes less specific than a /7 block).
BGPStream software framework
In January 2016, we released version 1.1.0 of BGPStream, a modular and scalable open-source software framework for the analysis of historical and live BGP measurement data. We introduced new functionalities in the core library, such as user-defined filters, and we designed and implemented architectural and performance improvements in the upper-layer components that enable BGP monitoring and outage detection in IODA (e.g., reduced computational complexity and latency, and more flexible mechanisms for synchronizing data obtained from distributed sources). We completed extensions to the BGPStream software framework to extract, from RIB dumps and individual BGP updates, the routing table exported by each Route Views/RIS monitor (~860 monitors) with 5 minute resolution. We presented on BGPStream in various places this year, including NANOG, AIMS, and at the Internet Measurement Conference (IMC). We started a collaboration with, and received funding from Cisco Systems to improve BGPStream's performance through native support for the OpenBMP protocol (BGPStream: a software framework for live and historical BGP data analysis, IMC).
UCSD Network Telescope
We develop and maintain a passive data collection system known as the UCSD Network Telescope to study Internet phenomena by monitoring and analyzing unsolicited traffic arriving at a globally routed underutilized /8 network. We are seeking to maximize the research utility of these data by enabling near-real-time data access to vetted researchers and solving the associated challenges in flexible storage, curation, and privacy-protected sharing of large volumes of data. As part of this effort, we share and support our Corsaro software for capture, processing, management, analysis, visualization and reporting on data collected with the UCSD Network Telescope. The current Near-Real-Time Network Telescope Dataset includes: (i) the most recent 60 days of raw telescope traffic (in pcap format); and (ii) aggregated flow data for all telescope traffic since February 2008 (in Corsaro flow tuple format).
Privacy-Sensitive Data Sharing / IMPACT
The Department of Homeland Security Information Marketplace for Policy and Analysis of Cyber-risk & Trust (IMPACT) project provides vetted researchers with network security-related data in a disclosure-controlled manner that respects the security, privacy, legal, and economic concerns of Internet users and network operators. IMPACT connects Data Providers with cybersecurity researchers. CAIDA contributes to the IMPACT Project as a Data Provider and Data Host, as well as with developing technical, legal, and practical aspects of IMPACT policies and procedures.
Data
Data Collection Statistics
The graphs below show the amount of raw data collected per day over the last few years by Archipelago (both IPv4 and IPv6 probing) and the UCSD Network Telescope. By the end of 2016, Archipelago collected about 11 GB of compressed data per day, while the UCSD Network Telescope received about 1 TB of compressed data per day.
![[Figure: Archipelago data capture per day]](images/team-probing.size.png)
![[Figure: Archipelago data capture per day (IPv6)]](images/team-probing-ipv6.size.png)
![[Figure: UCSD Network Telescope capture per day]](images/telescope-live.size.png)
In 2016, CAIDA captured the following raw data. (Storage space compressed and uncompressed in parenthesis.)
- IPv4 and IPv6 traceroutes collected by our Ark infrastructure (IPv4: 1.3 TB/3.9 TB, IPv6: 50.2 GB/248.7 GB).
- starting Dec 2015, daily traceroutes to a single target IPv4 address in each announced prefix in RIPE and RouteViews (1.0 TB/3.0 TB).
- passive traffic traces from equinix-chicago monitor connected to a Tier-1 ISP backbone links at the Equinix facilities in Chicago, IL (540.1 GB/1.3 TB)
- passive Internet background radiation (IBR) traffic traces collected by our UCSD Network Telescope (322.1 TB/786.1 TB)
- IPv4 Routed /24 Topology
- IPv4 Routed /24 DNS Names
- IPv4 Routed /24 AS Links
- IPv4 Prefix-Probing
- Macroscopic Internet Topology Data Kit ITDK-2016-03
- Macroscopic Internet Topology Data Kit ITDK-2016-09
- IPv6 Topology
- The IPv6 DNS Names
- IPv6 AS Links
- Anonymized Internet Traces 2016
- Complete Routed-Trace DNS Lookups
- AS Relationships with Geographic Annotations
We provided several academic researchers with access to our Near-Real-Time Network Telescope Dataset.
BGP-derived data We maintained the AS Rank web site and the related AS Relationships Dataset which use BGP data and empirical analysis algorithms developed by CAIDA researchers to infer business (routing) relationships between ASes. In 2016 we publicly released the AS Relationships Dataset with geographic annotations that estimate the geographic location of border links between pairs of networks.
We published our AS Classification dataset which classifies ASes by business type, and we documented our methodology for generating this dataset. We trained and validated this method with ground-truth data from PeeringDB, the largest source of self-reported data about the properties of ASes.
We list all available data, including legacy data, on our CAIDA Data page. In 2016 we began indexing data supplements from published CAIDA papers as well.
Data Distribution Statistics
Publicly Available Datasets require that users agree to CAIDA's Acceptable Use Policy for public data, but are otherwise freely available. The graphs below show the number of unique visitors and the total amount of data downloaded annually. In February 2014, we began to make more data unrestricted, resulting in large growth in downloads of this type of data, especially in 2015. Since mid-2016 we make the UCSD Network Telescope data exclusively available through IMPACT (many other CAIDA datasets are available both through IMPACT, and directly from CAIDA). These graphs do not yet reflect downloads through IMPACT.
![[Figure: request counts statistics for public data]](images/2016_annual_report_public_count.png)
![[Figure: download statistics for public data]](images/2016_annual_report_public_download.png)
* Volume downloaded per unique user per unique file. (Multiple downloads of same file, which is common, only counted once.)
Restricted Access Data Sets require that users: be academic or government researchers, or sponsors; request an account and provide a brief description of their intended use of the data; and agree to an Acceptable Use Policy. Below the graph on the left shows the number of requests for restricted data we received and approved (typically about 75-80% of requests are approved). The graph on the right shows the data downloaded annually by these users. Our loss of the backbone traffic monitor in April 2016 led to a drop in available traffic data (and thus downloads) for 2016.
![[Figure: request statistics for restricted data]](images/2016_annual_report_restricted_count.png)
![[Figure: download statistics for restricted data]](images/2016_annual_report_restricted_download.png)
* Volume downloaded per unique user per unique file. (Multiple downloads of same file, which is common, only counted once.)
Publications using public and/or restricted CAIDA data (by non-CAIDA authors)
We know of a total of 200 publications in 2016 by non-CAIDA authors that used these CAIDA data. (Not all publications are reported back to us, so this is a lower bound that we update as we learn of new publications.) Some of these papers used more than one dataset. The latest list is at: Non-CAIDA Publications using CAIDA Data
Tools
In addition to the research infrastructure projects described in previous sections, CAIDA develops supporting tools for Internet data collection, analysis and visualization. The following table displays CAIDA developed and currently supported tools and number of external downloads of each version during 2016. In an effort to present meaningful statistics, we tally the total tool downloads by unique IP addresses.
![[Figure: The number of times each tool was downloaded from
the CAIDA web site in 2016.]](images/caida-tools-downloads-2016.jpg)
| Tool | Description | Downloads |
|---|---|---|
| arkutil | RubyGem containing utility classes used by the Archipelago measurement infrastructure and the MIDAR alias-resolution system. | 239 |
| Autofocus | Internet traffic reports and time-series graphs. | 278 |
| BGPStream | Open-source software framework for live and historical BGP data analysis, supporting scientific research, operational monitoring, and post-event analysis | 427 |
| Chart::Graph | A Perl module that provides a programmatic interface to several popular graphing package | 166 |
| CoralReef | Measures and analyzes passive Internet traffic monitor data. | 416 |
| Corsaro | Extensible software suite designed for large-scale analysis of passive trace data captured by darknets, but generic enough to be used with any type of passive trace data. | 332 |
| Cuttlefish | Produces animated graphs showing diurnal and geographical patterns. | 178 |
| dbats | High performance time series database engine | 56 |
| dnsstat | DNS traffic measurement utility. | 251 |
| iatmon | Ruby+C+libtrace analysis module that separates one-way traffic into defined subsets. | 93 |
| iffinder | Discovers IP interfaces belonging to the same router. | 341 |
| libsea | Scalable graph file format and graph library. | 183 |
| kapar | Graph-based IP alias resolution. | 93 |
| Marinda | A distributed tuple space implementation. | 139 |
| MIDAR | Monotonic ID-Based Alias Resolution tool that identifies IPv4 addresses belonging to the same router (aliases) and scales up to millions of nodes. | 134 |
| Motu | Dealiases pairs of IPv4 addresses. | 67 |
| mper | Probing engine for conducting network measurements with ICMP, UDP, and TCP probes. | 190 |
| otter | Visualizes arbitrary network data. | 543 |
| plot-latlong | Plots points on geographic maps. | 185 |
| plotpaths | Displays forward traceroute path data. | 94 |
| rb-mperio | RubyGem for writing network measurement scripts in Ruby that use the mper probing engine. | 335 |
| RouterToAsAssignment | Assigns each router from a router-level graph to its Autonomous System (AS). | 445 |
| rv2atoms (including straightenRV) | A tool to analyze and process a Route Views table and compute BGP policy atoms. | 79 |
| scamper | A tool to actively probe the Internet to analyze topology and performance | 295 |
| sk_analysis_dump | A tool for analysis of traceroute-like topology data. | 134 |
| topostats | Computes various statistics on network topologies. | 179 |
| Walrus | Visualizes large graphs in three-dimensional space. | 845 |
Publications
(ordered by primary topic area, but many cross multiple topics)- The 7th Workshop on Active Internet Measurements (AIMS-7) Report, ACM SIGCOMM CCR, Jan 2016.
- Survey of End-to-End Mobile Network Measurement Testbeds, IEEE Comm. Surveys & Tutorials, Jan 2016.
- Periscope: Unifying Looking Glass Querying, Passive and Active Measurement (PAM), Mar 2016.
- Sibyl: A Practical Internet Route Oracle, USENIX Networked Systems Design &Implementation (NSDI), Mar 2016.
- The 8th Workshop on Active Internet Measurements (AIMS8) Report, ACM SIGCOMM CCR, Oct 2016.
- bdrmap: Inference of Borders Between IP Networks, Internet Measurement Conference (IMC), Nov 2016.
- Statistical implications of augmenting a BGP-inferred AS-level topology with traceroute-based inferences - Technical Report, Center for Applied Internet Data Analysis (CAIDA), Nov 2016.
Internet Topology Mapping, Measurement, Analysis, and Modeling
- Teaching Network Security With IP Darkspace Data, IEEE Transactions on Education, Feb 2016.
- Lost in Space: Improving Inference of IPv4 Address Space Utilization, IEEE JSAC, Jun 2016.
- The BGP Hackathon 2016 Report, ACM SIGCOMM CCR, Jul 2016.
- BGPStream: a software framework for live and historical BGP data analysis, Internet Measurement Conference (IMC), Nov 2016.
Monitoring Global Internet Security and Stability
- First Amended Report of AT&T Independent Measurement Expert: Reporting requirements and measurement methods, Federal Communications Commission (FCC), Jun 2016.
- Workshop on Internet Economics (WIE2015) Report, ACM SIGCOMM CCR, Jul 2016.
- Report of AT&T Independent Measurement Expert Background and supporting arguments for measurement and reporting requirements, Federal Communications Commission (FCC), Aug 2016.
- Policy challenges in mapping Internet interdomain congestion, Telecommunications Policy Research Conference (TPRC), Oct 2016.
Economics and Policy
- Don't Forget to Lock the Back Door! A Characterization of IPv6 Network Security Policy, NDSS, Feb 2016.
- NAT Revelio: Detecting NAT444 in the ISP, Passive and Active Measurement (PAM), Mar 2016.
- Characterizing IPv6 control and data plane stability, IEEE INFOCOM, Apr 2016.
- Reasons Dynamic Addresses Change, IMC, Nov 2016.
Future Internet Research
- The Second Named Data Networking Community Meeting (NDNcomm 2015), ACM SIGCOMM CCR, Jan 2016.
- Named Data Networking Next Phase (NDN-NP) Project May 2015 - April 2016 Annual Report, Jun 2016.
Future Internet Research: Named Data Networking
CAIDA 2016 in Numbers
In 2016, CAIDA published 13 peer-reviewed papers, 3 technical reports, 4 workshop reports, one (our first) BGP hackathon report, 31 presentations, 20 blog entries, and hosting 6 workshops (including the hackathon). CAIDA researchers presented their results and findings at NANOG (Dallas, TX), PAM (Heraklion, Greece), INFOCOM (San Francisco, CA), AusNOG (Sydney, Australia), TPRC (Arlington, VA), IMC (Santa Monica, CA), and USENIX NSDI (Santa Clara, CA), and at other workshops and meetings. A complete list of presented materials are available on CAIDA Presentations page.
We organized and hosted the first CAIDA BGP Hackathon, held on 6-7 February 2016. Around 90 researchers and students from academia, industry and other institutions around the world, participated in the event, themed on live BGP measurements and monitoring.
We organized and hosted five workshops including AIMS 2016: Workshop on Active Internet Measurements, the 6th NDN Retreat, a small symposium on peering economics in April, a small workshop on Internet Measurement and Political Science 2016: Conflict and Contention in the Digital Age, the 6th NDN Retreat, and WIE 2016: 7th Workshop on Internet Economics.
In 2016, our web site www.caida.org attracted 337,309 unique visitors, with an average of 1.89 visits per visitor, serving an average of 20.95 pages per visit.
During 2016, CAIDA employed 14 staff (researchers, programmers, data administrators, technical support staff), hosted 11 visiting scholars, 3 postdocs, 4 graduate students, 11 undergraduate students, and 1 high school student volunteer.
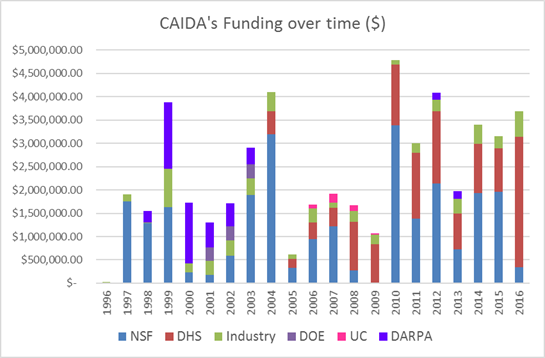
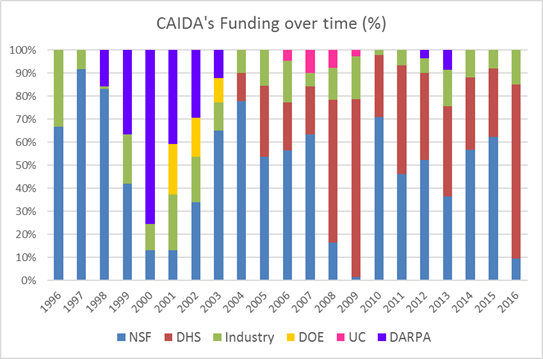
We received $3.69M to support our research activities from the following sources:
![[Figure: Allocations by funding source]](images/allocation_byfunding_2016.png)
| Funding Source | Amount ($) | Percentage |
|---|---|---|
| NSF | $347,758 | 9% |
| DHS | $2,786,901 | 76% |
| AT&T | $322,640 | 9% |
| Gift & Members | $231,358 | 6% |
| Total | $3,688,657 | 100% |
Two views of historical funding allocations are shown below, presented by total amount received and by percentage based on funding source.
These charts below show CAIDA expenses, by type of operating expenses and by program area:
![[Figure: Operating Expenses]](images/operating_expenses_2016.png)
| Expense Type | Amount ($) | Percentage |
|---|---|---|
| Labor | $1,992,403.74 | 55% |
| Indirect Costs (IDC) | $1,147,197.46 | 32% |
| Professional Development | $16,287.08 | <1% |
| Supplies & Expenses | $81,081.92 | 2% |
| Workshop & Visitor Support | $92,945.21 | 3% |
| CAIDA Travel | $34,522.23 | 1% |
| Subcontracts | $166,666.90 | 5% |
| Equipment | $103,182.65 | 3% |
| Total | $3,634,287.19 | 100% |
![[Figure: Expenses by Program Area]](images/expenses_byprogram_2016.png)
| Program Area | Amount ($) | Percentage |
|---|---|---|
| Economics & Policy | $362,390 | 10% |
| Future Internet | $322,817 | 9% |
| Mapping & Congestion | $631,568 | 17% |
| Infrastructure | $1,228,201 | 34% |
| Security & Stability | $948,109 | 26% |
| Outreach | $115,513 | 3% |
| CAIDA Internal Operations | $25,690 | 1% |
| Total | $3,634,287 | 100% |
Supporting Resources
CAIDA's accomplishments are in large measure due to the high quality of our visiting students and collaborators. We are also fortunate to have financial and IT support from sponsors, members, and collaborators, and monitoring hosting sites.
UC San Diego Students
- Karyn Benson, PhD student at UC San Diego
- Alex Gamero-Garrido, PhD student at UC San Diego
- Jaehyun Park, graduate student at UC San Diego
Visiting Students and Scholars
- Danilo Cicalese, PhD student from Télécom ParisTech, France
- Bernardo Duarte, undergraduate student from Universidade de São Paolo
- Roderick Fanou, PhD student intern from University Carlos III Madrid
- Julien Gilon, graduate student from Université de Liège, Belgium
- Danilo Giordano, graduate student from Politechnico di Torino, Italy
- Vasileios Giotsas, postdoc from University College London (UCL)
- Thomas Holterbach, PhD student from ETH Zurich
- Siyuan Jia, PhD student from Northeastern University in Shengyang, China
- Ioana Livadariu, PhD student from University of Oslo
- Ricky Mok, postdoc from Hong Kong Polytechnic University
- Chiara Orsini, postdoc from University of Pisa, Italy
- Roland van Rijswijk, PhD student from University of Twente
- Jordi Levy, research scientist from IIIA-CSIC
Funding Sources
- NSF grant (CNS-1228994) Detection and analysis of large-scale Internet infrastructure outages
- DHS S&T contract (N66001-12-C-0130) Cartographic Capabilities for Critical Cyberinfrastructure
- NSF grant (CNS-1345286) Named Data Networking Next Phase
- NSF grant (CNS-1111449) Exploring the evolution of IPv6: topology, performance, and traffic
- DHS S&T contract (D15PC00188) Software Systems for Surveying Spoofing Susceptibility
- NSF grant (NSF CNS-1513283) Internet Laboratory for Empirical Network Science: Next Phase
- NSF grant (NSF CNS-1528148) Modeling IPv6 Adoption: A Measurement-driven Computational Approach
- NSF grant (NSF CNS-1513847) Economics of Contractual Arrangements for Internet Interconnections
- NSF grant (NSF CNS-1414177) Mapping Interconnection in the Internet: Colocation, Connectivity and Congestion
- NSF grant (NSF CNS-1423659) HIJACKS: Detecting and Characterizing Internet Traffic Interception based on BGP Hijacking
- DHS S&T Cooperative Agreement (DHS FA8750-12-2-0326) Supporting Research and Development of Security Technologies through Network and Security Data Collection
- DHS S&T contract (HHSP 233201600012C) Science of Internet Security: Technology and Experimental Research
- University Research sponsorship from Cisco Systems, Inc., Comcast, and NTT Corporation.